| Start Page |
|
 |
| Start Page |
|
|
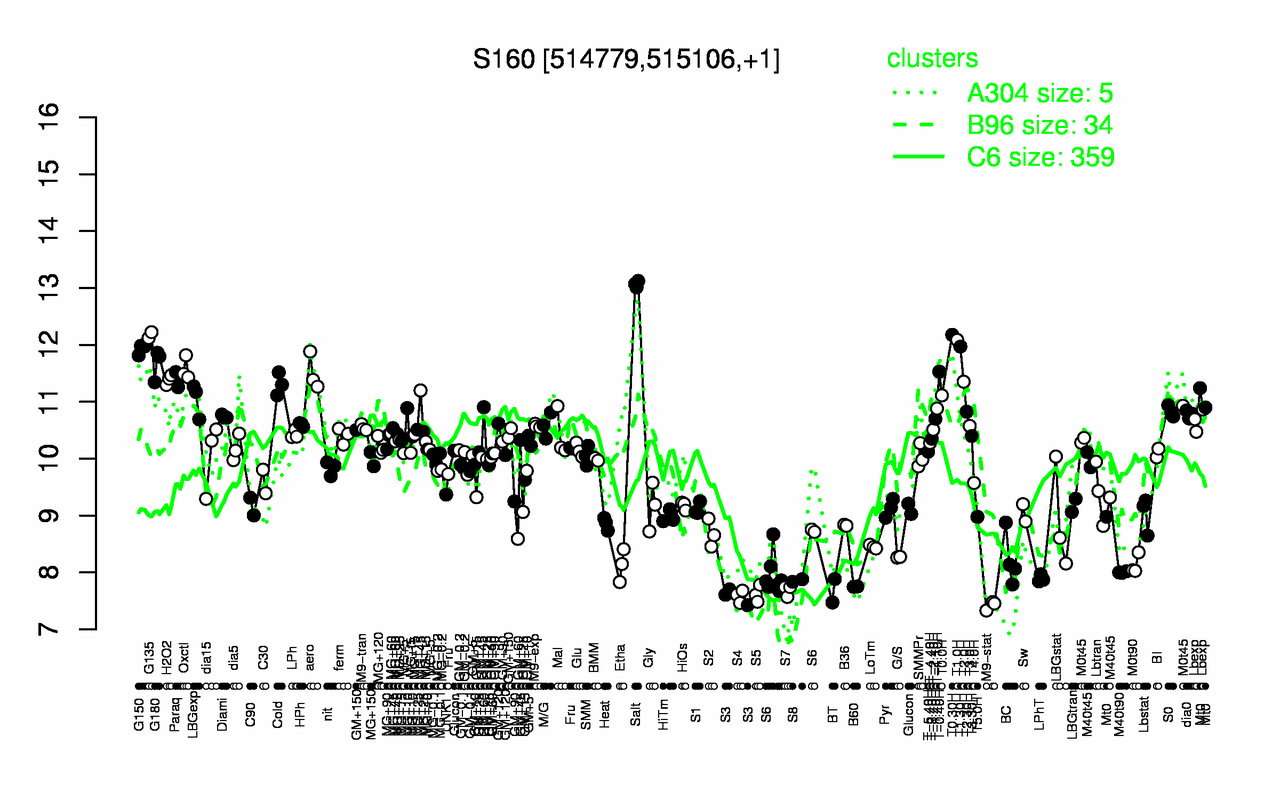
| Salt | T0.30H | G135 | T1.0H | T1.30H | G150 | G180 | Oxctl | T-0.40H | aero |
| 13.1 | 12.2 | 12.2 | 12.1 | 12 | 11.9 | 11.7 | 11.6 | 11.5 | 11.5 |
| M9-stat | S3 | S4 | S5 | BT | S7 | B60 | S8 | LPhT | M40t90 |
| 7.42 | 7.58 | 7.58 | 7.62 | 7.68 | 7.68 | 7.75 | 7.86 | 7.89 | 8 |