| Start Page |
|
 |
| Start Page |
|
|
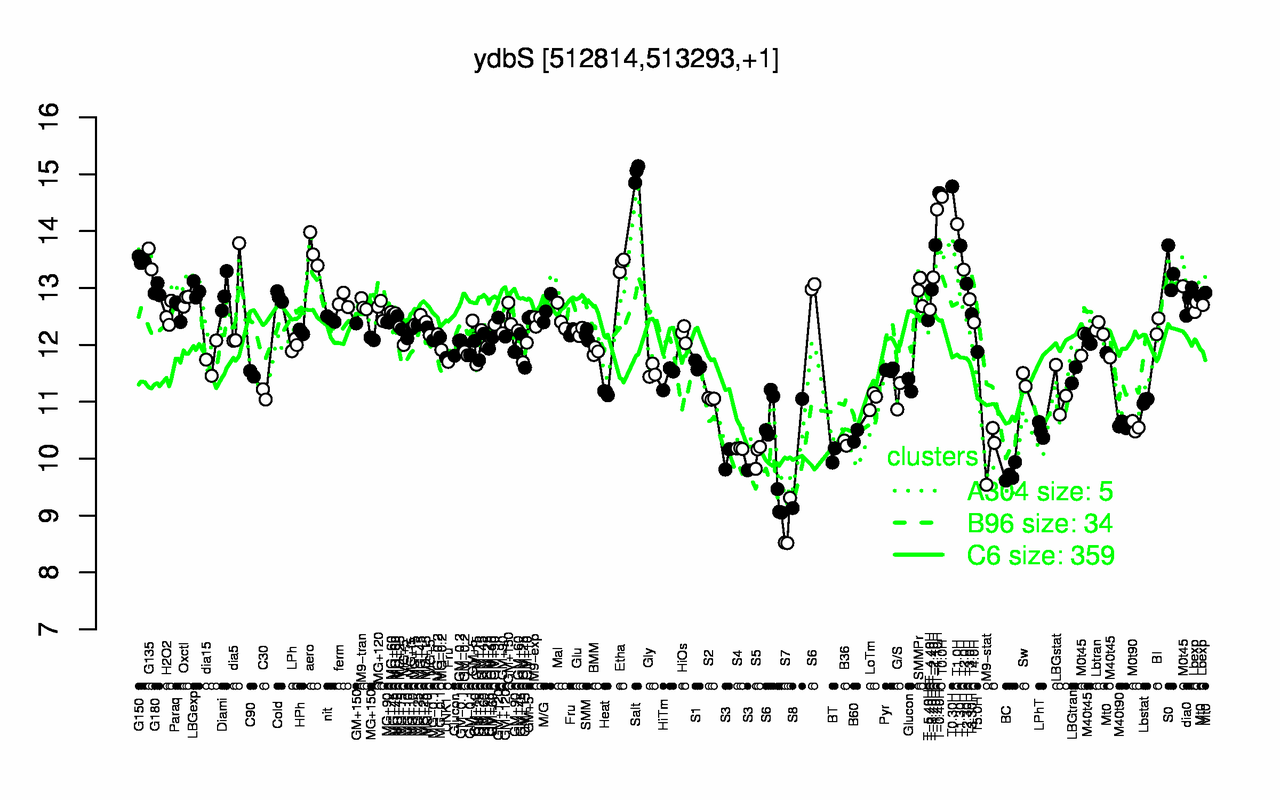
| Salt | T0.30H | T-0.40H | T0.0H | T-1.10H | T1.0H | T-1.40H | T1.30H | aero | G135 |
| 15 | 14.8 | 14.7 | 14.6 | 14.4 | 14.1 | 13.8 | 13.7 | 13.7 | 13.5 |
| S7 | BC | S3 | BT | S5 | S8 | M9-stat | S4 | B36 | B60 |
| 8.78 | 9.73 | 9.92 | 10.1 | 10.1 | 10.1 | 10.1 | 10.2 | 10.3 | 10.4 |