| Start Page |
|
 |
| Start Page |
|
|
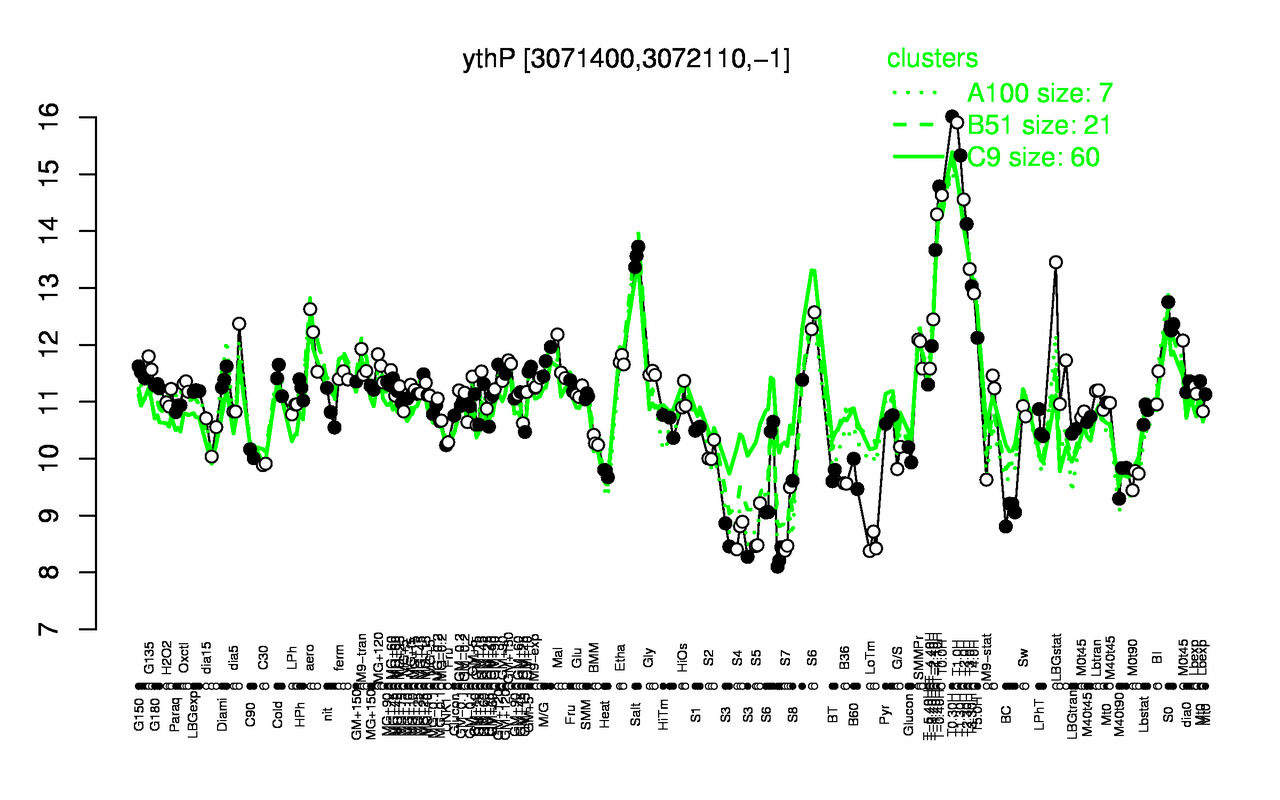
| T0.30H | T1.0H | T1.30H | T-0.40H | T0.0H | T2.0H | T-1.10H | T2.30H | T-1.40H | Salt |
| 16 | 15.9 | 15.3 | 14.8 | 14.6 | 14.6 | 14.3 | 14.1 | 13.7 | 13.6 |
| LoTm | S3 | S4 | S5 | S7 | BC | B36 | M0t90 | M40t90 | BT |
| 8.51 | 8.53 | 8.7 | 8.72 | 8.78 | 9.07 | 9.56 | 9.66 | 9.66 | 9.7 |