| Start Page |
|
 |
| Start Page |
|
|
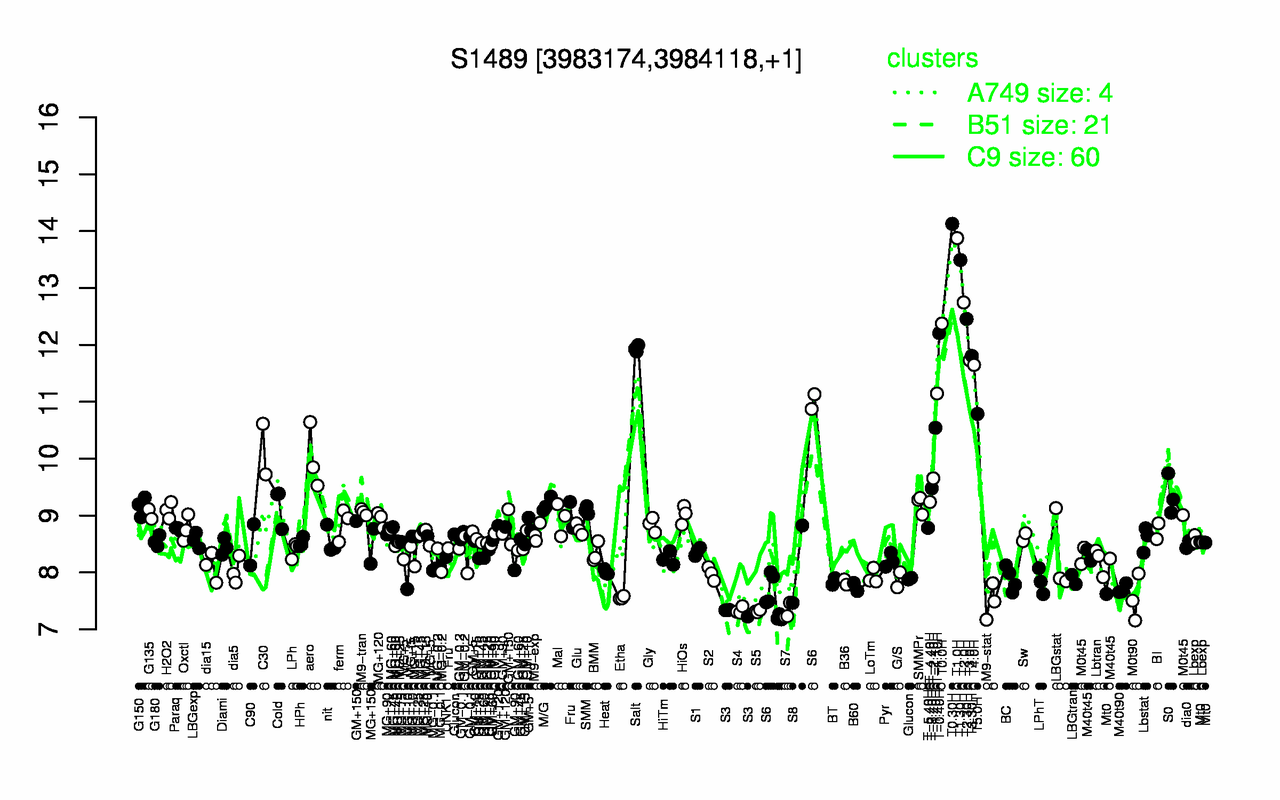
| T0.30H | T1.0H | T1.30H | T2.0H | T2.30H | T0.0H | T-0.40H | Salt | T3.30H | T3.0H |
| 14.1 | 13.9 | 13.5 | 12.7 | 12.5 | 12.4 | 12.2 | 11.9 | 11.8 | 11.7 |
| S3 | S7 | S5 | S4 | M9-stat | M0t90 | Etha | M40t90 | B60 | B36 |
| 7.3 | 7.31 | 7.32 | 7.34 | 7.49 | 7.55 | 7.56 | 7.71 | 7.74 | 7.83 |