| Start Page |
|
 |
| Start Page |
|
|
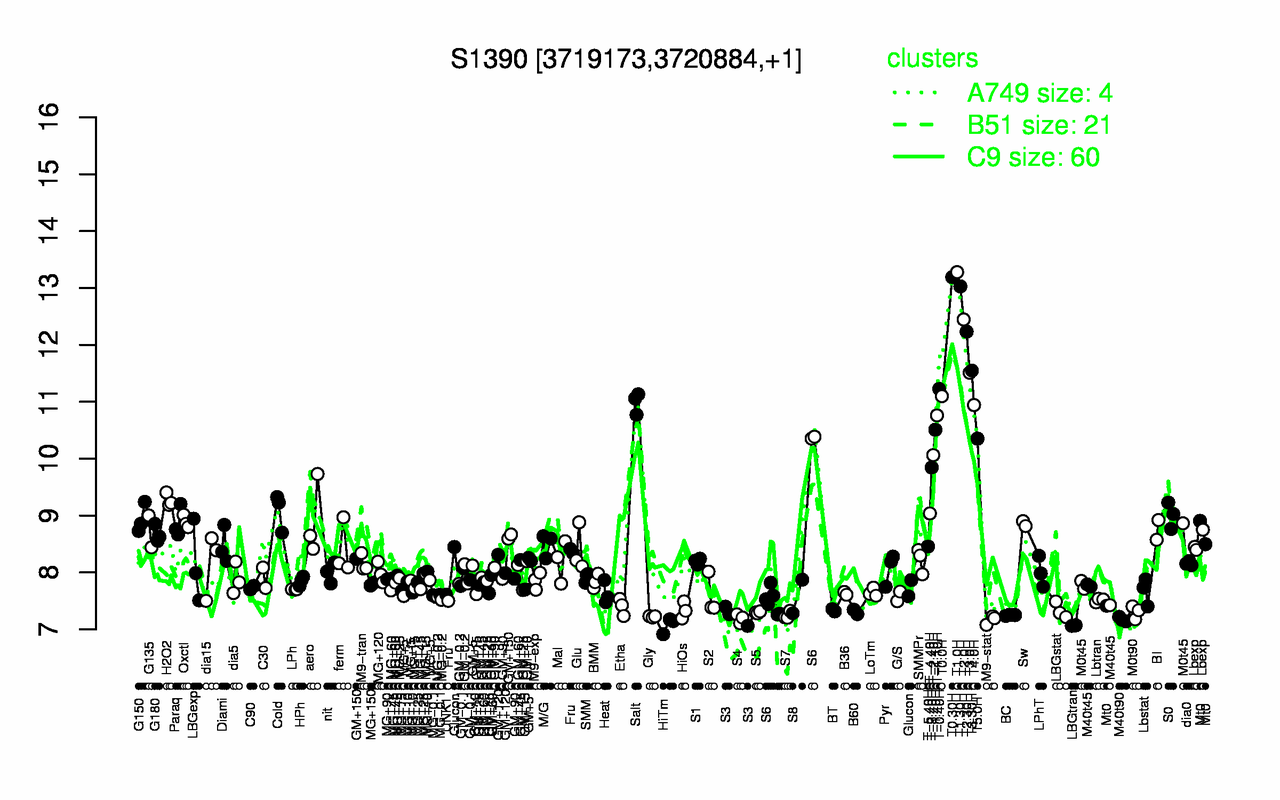
| T1.0H | T0.30H | T1.30H | T2.0H | T2.30H | T3.30H | T3.0H | T-0.40H | T0.0H | Salt |
| 13.3 | 13.2 | 13 | 12.4 | 12.2 | 11.5 | 11.5 | 11.2 | 11.1 | 11 |
| LBGtran | HiTm | M9-stat | M40t90 | S4 | Gly | S3 | S7 | BC | S5 |
| 7.07 | 7.08 | 7.17 | 7.17 | 7.19 | 7.22 | 7.24 | 7.25 | 7.25 | 7.3 |