| Start Page |
|
 |
| Start Page |
|
|
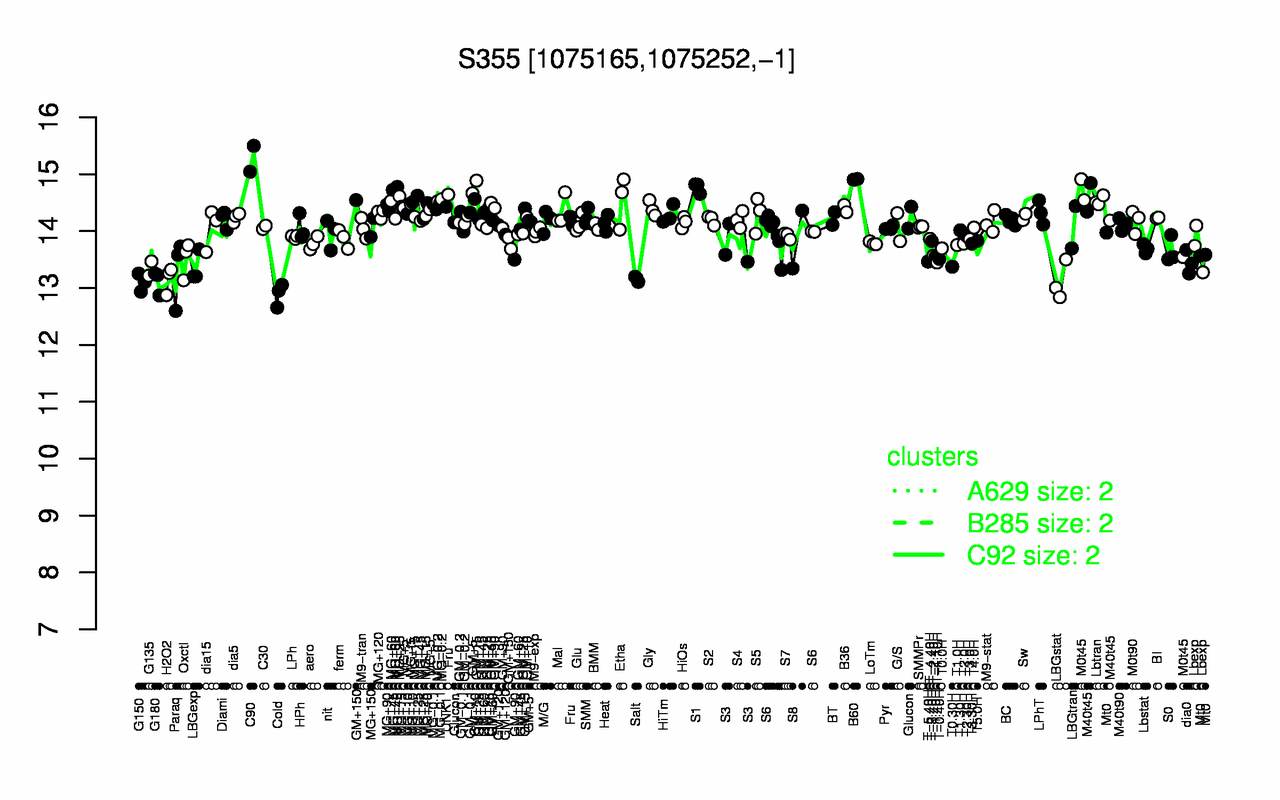
| C90 | B60 | S1 | GM+15 | MG+45 | MG-0.2 | Etha | Lbtran | MG+25 | MG+t5 |
| 15.3 | 14.9 | 14.8 | 14.6 | 14.6 | 14.5 | 14.5 | 14.5 | 14.5 | 14.5 |
| Cold | G150 | LBGstat | G180 | H2O2 | Salt | Paraq | G135 | LBGexp | T0.30H |
| 12.9 | 13.1 | 13.1 | 13.1 | 13.2 | 13.2 | 13.3 | 13.3 | 13.4 | 13.4 |