| Start Page |
|
 |
| Start Page |
|
|
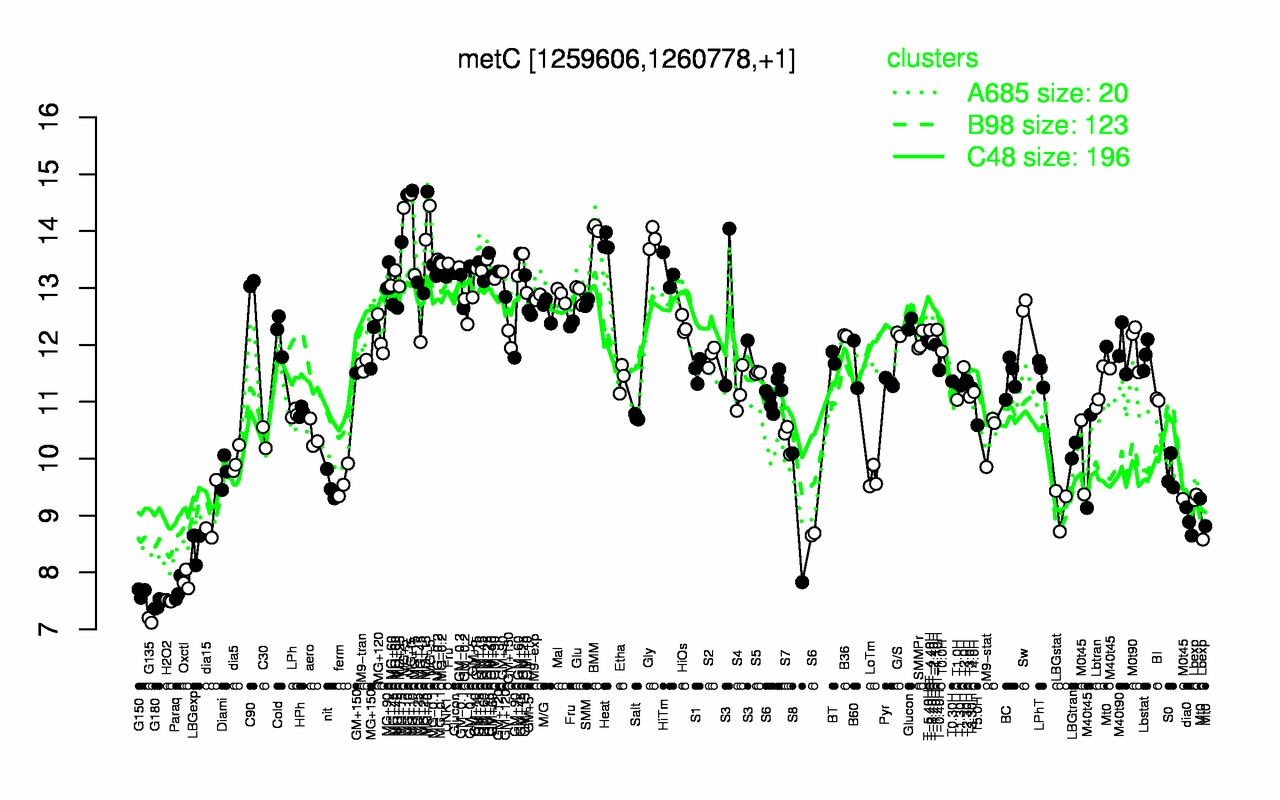
| MG+10 | MG+t5 | MG+5 | BMM | Gly | Heat | MG+15 | GM+25 | MG-0.2 | GM+15 |
| 14.7 | 14.6 | 14.4 | 14.1 | 13.9 | 13.8 | 13.6 | 13.5 | 13.5 | 13.4 |
| G135 | G180 | H2O2 | G150 | Paraq | Oxctl | LBGexp | dia0 | S8 | dia15 |
| 7.16 | 7.43 | 7.5 | 7.65 | 7.7 | 7.86 | 8.47 | 8.89 | 8.96 | 9 |