| Start Page |
|
 |
| Start Page |
|
|
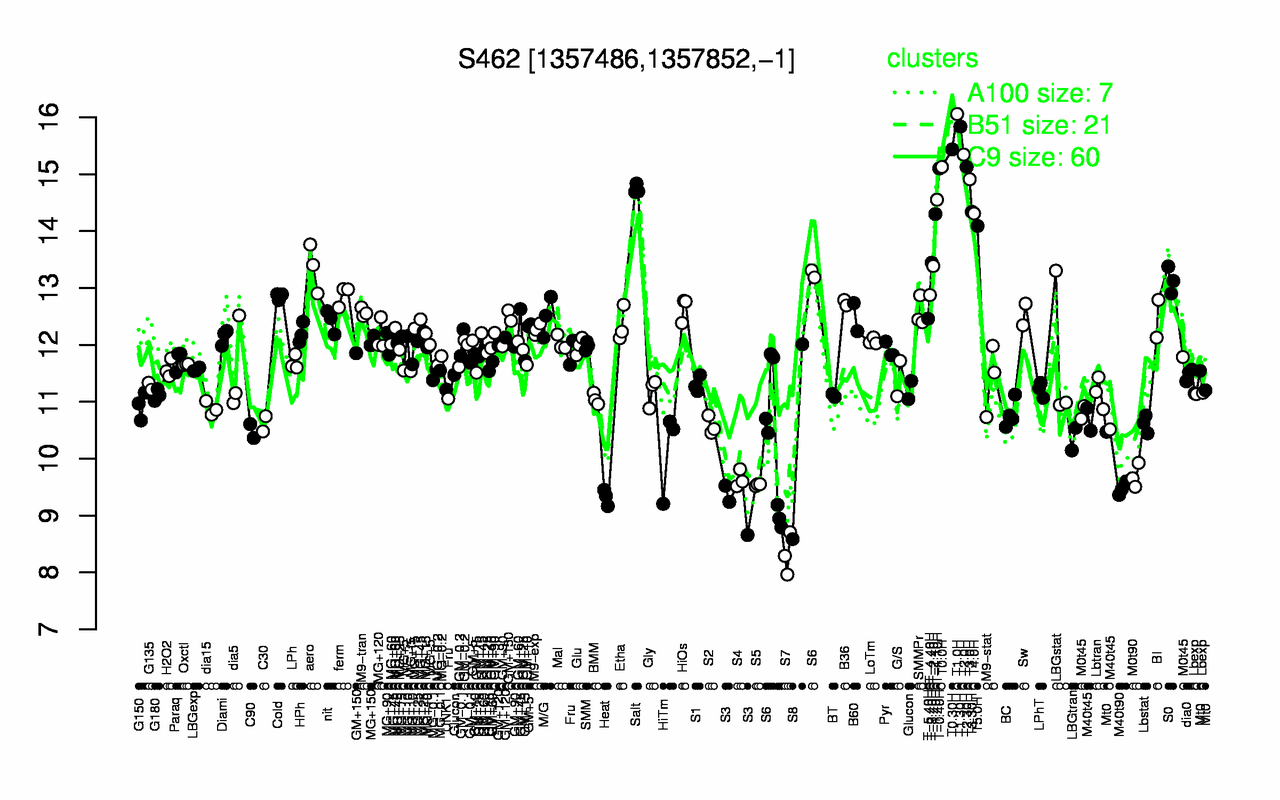
| T1.0H | T1.30H | T0.30H | T2.0H | T0.0H | T2.30H | T-0.40H | T3.0H | Salt | T-1.10H |
| 16.1 | 15.8 | 15.4 | 15.3 | 15.1 | 15.1 | 15.1 | 14.9 | 14.7 | 14.6 |
| S7 | S3 | Heat | M40t90 | S5 | S4 | M0t90 | HiTm | S8 | LBGtran |
| 8.32 | 9.14 | 9.32 | 9.48 | 9.54 | 9.64 | 9.7 | 10.1 | 10.3 | 10.3 |