B. subtilis Expression Data Browser
Start Page
B. subtilis Expression Data Browser
Gene/Segment:
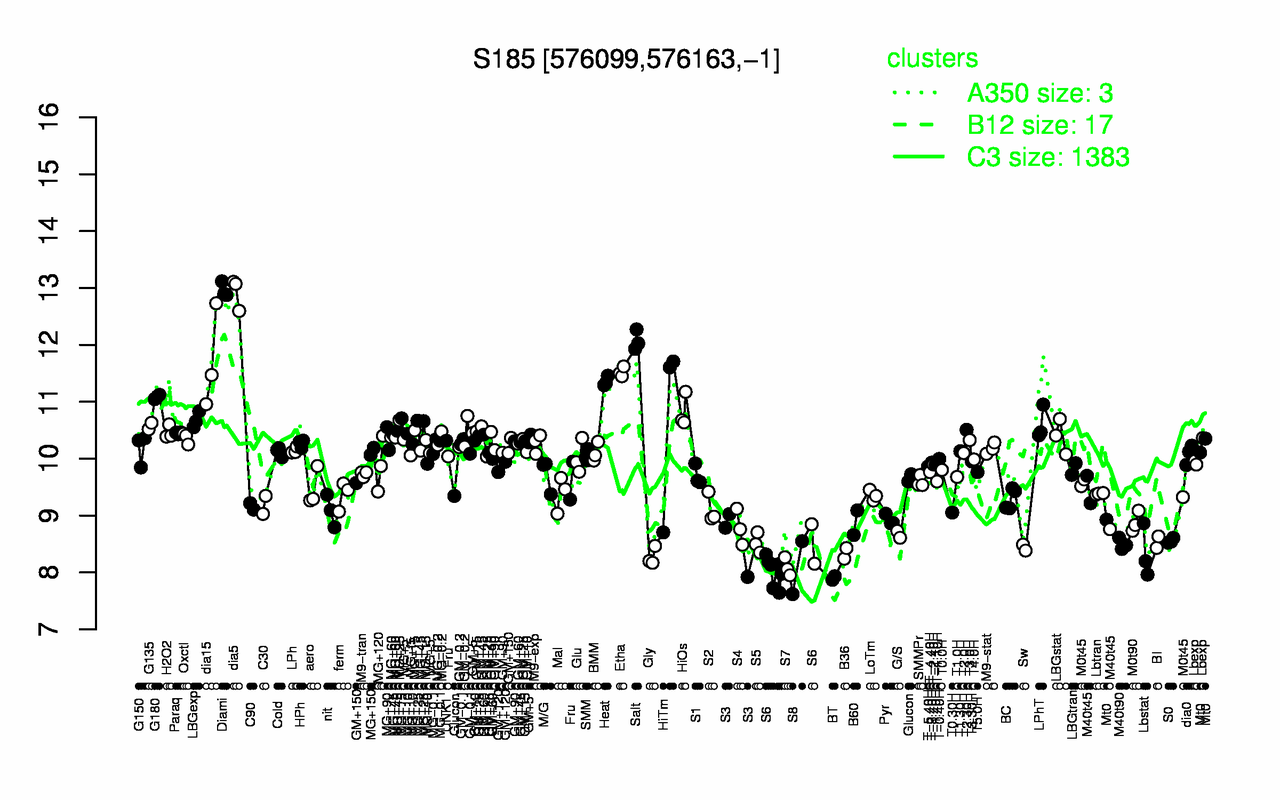
S185
Locus Tag:
new_576099_576163_c
Details about S185
Show/Hide
Highest Expression Conditions
Diami
dia5
Salt
dia15
Etha
Heat
G180
HiOs
LBGexp
HiTm
13
12.9
12.1
11.7
11.5
11.4
11.1
10.8
10.7
10.7
Lowest Expression Conditions
BT
S8
S7
S6
Gly
B36
Lbstat
Sw
M40t90
S5
7.9
8.08
8.09
8.12
8.28
8.33
8.34
8.44
8.5
8.52
Most Positively Correlated Segments
ydeP
ykvN
tadA
ydgJ
yyzM
S16
ydeQ
S1440
rsbRA
S1578
0.99
0.83
0.82
0.8
0.8
0.79
0.79
0.79
0.78
0.77
Most Negatively Correlated Segments
S1111
ctaG
ctaF
ctaC
ctaE
ctaD
S1112
cccA
spoVS
ykoM
-0.81
-0.74
-0.73
-0.73
-0.72
-0.72
-0.7
-0.69
-0.69
-0.68
Expression Profile of Segment S185
Show/Hide
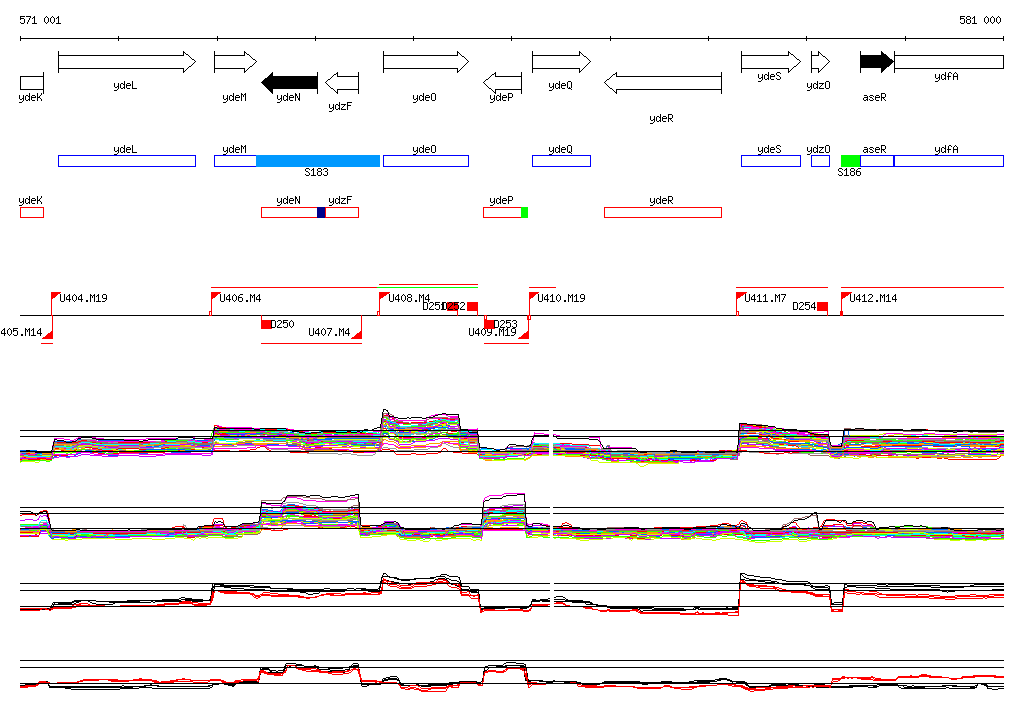
Genomic View of Gene/Segment S185
Show/Hide
(Legend)
Browse Genome Context