| Start Page |
|
 |
| Start Page |
|
|
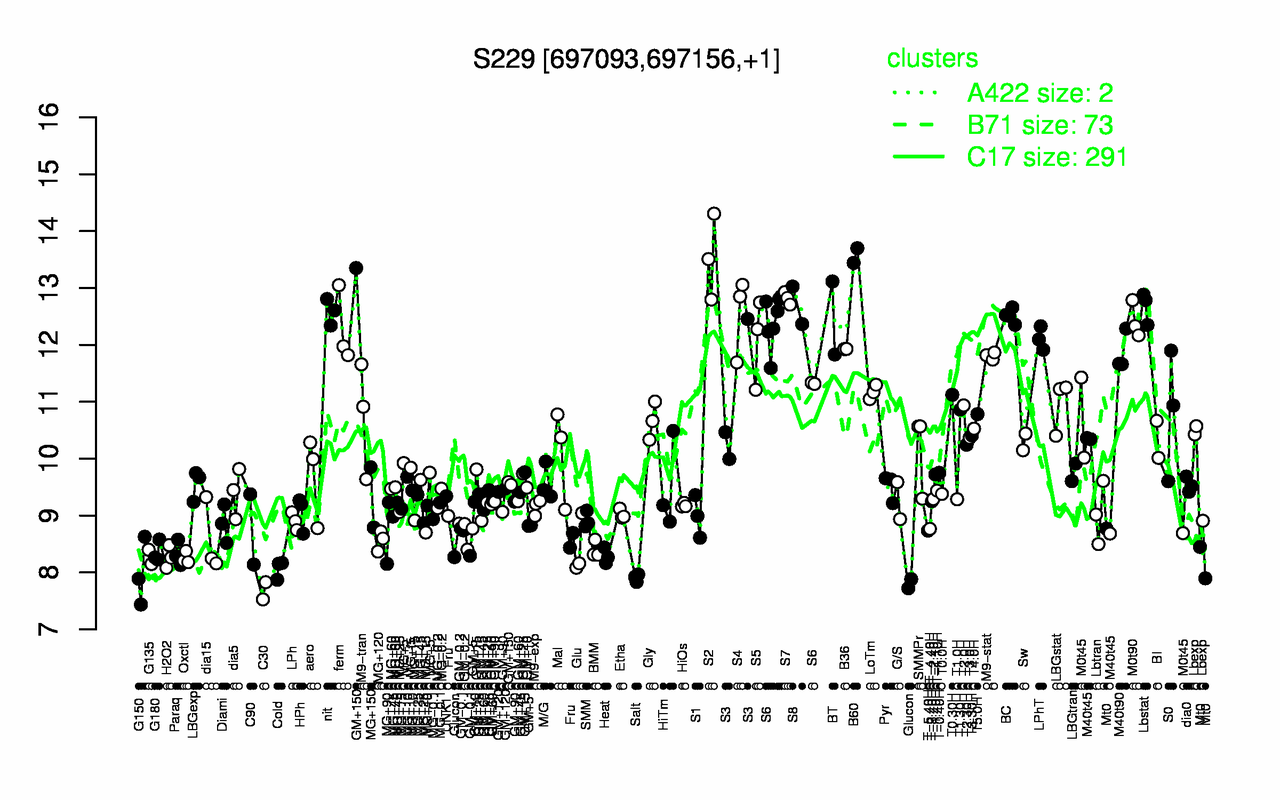
| B60 | S2 | S7 | S8 | Lbstat | nit | S4 | BC | BT | M0t90 |
| 13.6 | 13.5 | 12.8 | 12.7 | 12.7 | 12.6 | 12.5 | 12.5 | 12.5 | 12.4 |
| C30 | Salt | Glucon | G150 | Cold | Oxctl | H2O2 | G135 | Heat | Paraq |
| 7.68 | 7.91 | 7.96 | 7.98 | 8.06 | 8.25 | 8.27 | 8.27 | 8.29 | 8.33 |