B. subtilis Expression Data Browser
Start Page
B. subtilis Expression Data Browser
Gene/Segment:
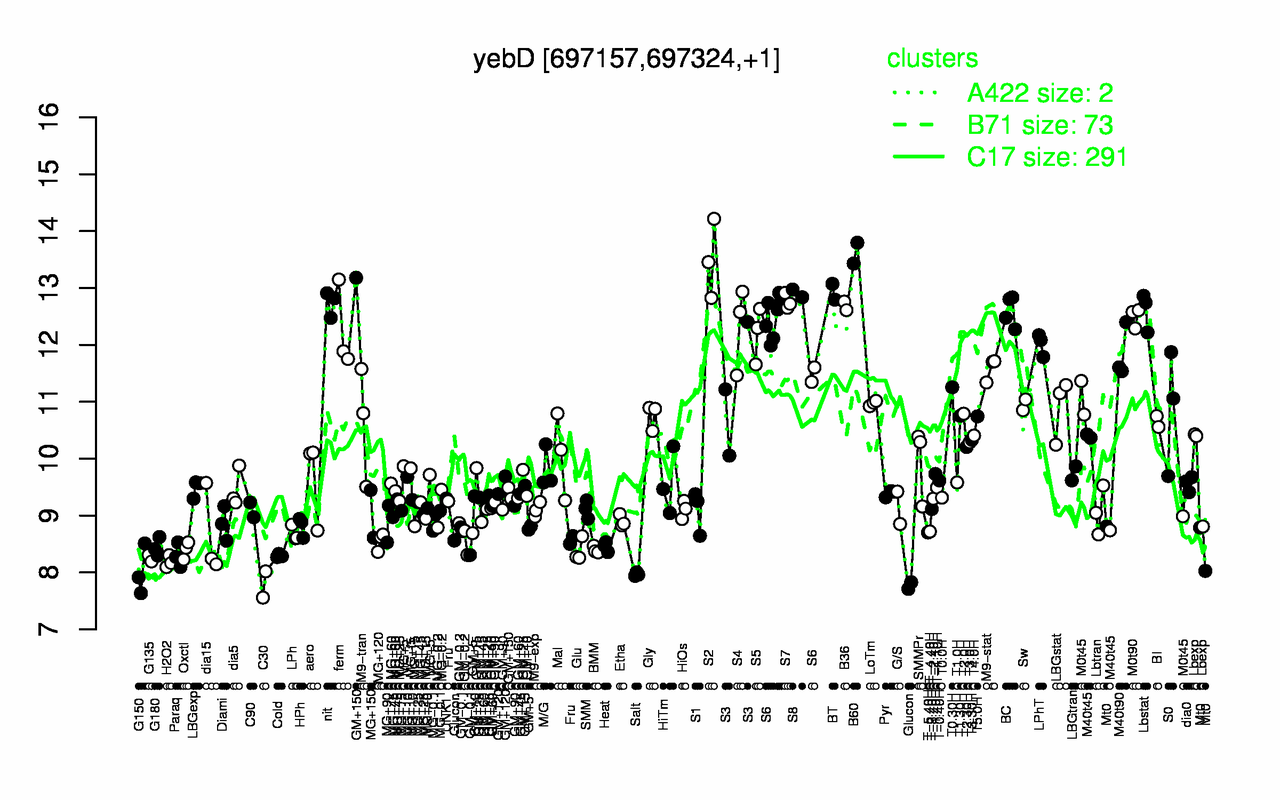
yebD
Locus Tag:
BSU06390
Details about yebD
Show/Hide
Highest Expression Conditions
B60
S2
BT
S8
S7
nit
B36
Lbstat
BC
M0t90
13.6
13.5
12.9
12.9
12.8
12.7
12.7
12.6
12.6
12.5
Lowest Expression Conditions
C30
Salt
G150
Glucon
H2O2
G135
Cold
Paraq
Glu
Oxctl
7.79
7.97
8.02
8.03
8.19
8.25
8.29
8.3
8.39
8.4
Most Positively Correlated Segments
S229
yoqM
S437
yjdB
ctaG
S1111
ctaF
ytzJ
ctaE
S1112
0.99
0.86
0.82
0.81
0.79
0.78
0.78
0.77
0.77
0.75
Most Negatively Correlated Segments
nrnA
S199
rsmE
ispE
yuaC
yhcE
hepS
S298
ndh
pcrB
-0.82
-0.77
-0.75
-0.75
-0.74
-0.74
-0.74
-0.74
-0.74
-0.74
Expression Profile of Segment yebD
Show/Hide
Annotation of Gene yebD
Show/Hide
inference
ab initio prediction:AMIGene:2.0
codon_start
1
product
hypothetical protein
transl_table
11
note
Evidence 5: No homology to any previously reported sequences
db_xref
GI:225184789
protein_id
CAB12458.3
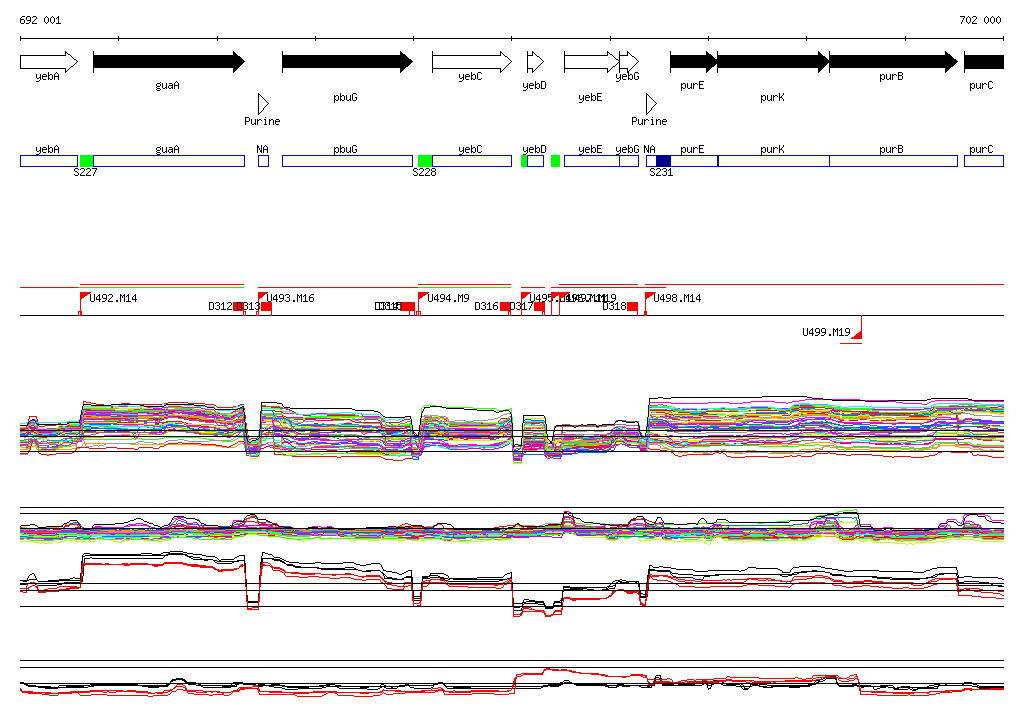
Genomic View of Gene/Segment yebD
Show/Hide
(Legend)
Browse Genome Context