| Start Page |
|
 |
| Start Page |
|
|
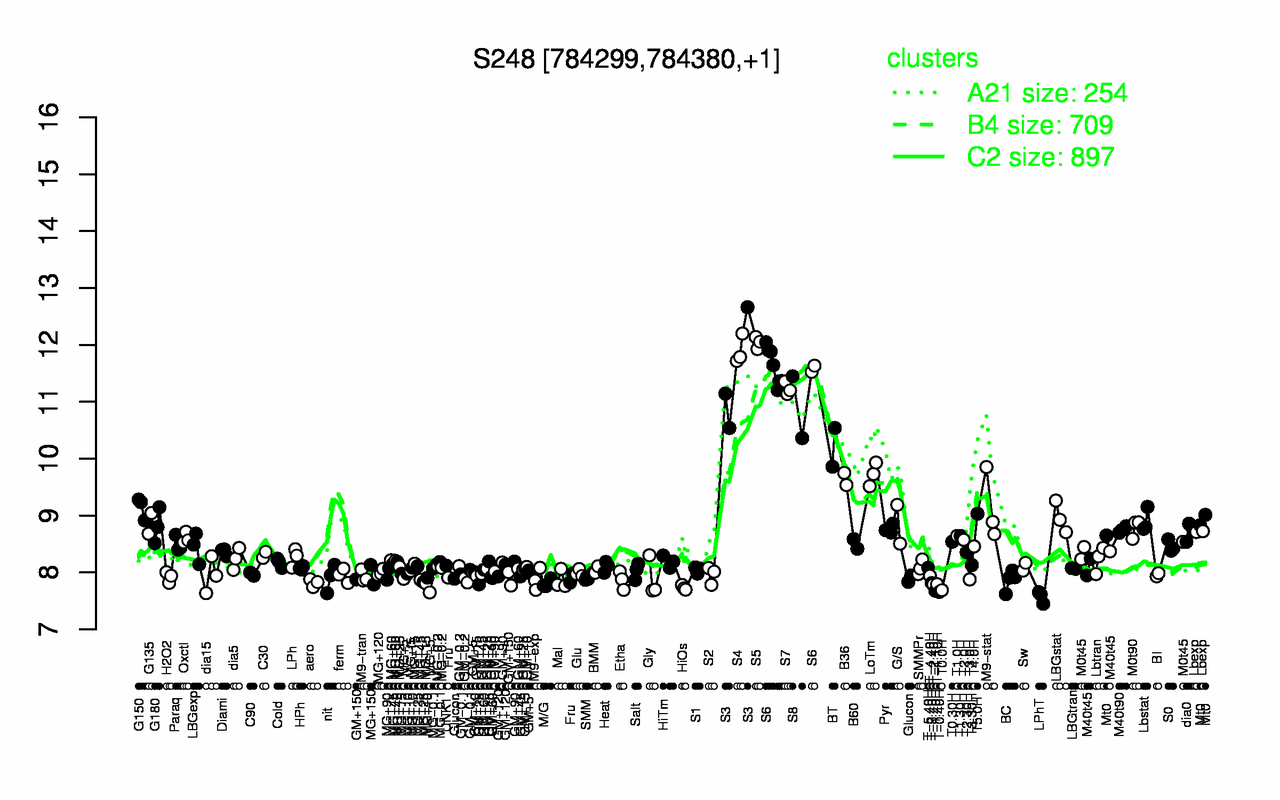
| S5 | S4 | S6 | S3 | S7 | S8 | BT | LoTm | B36 | G150 |
| 12 | 11.9 | 11.6 | 11.4 | 11.2 | 10.9 | 10.2 | 9.73 | 9.64 | 9.14 |
| LPhT | T-0.40H | T-1.40H | T0.0H | HiOs | MG+5 | T-2.40H | T-1.10H | M/G | T-3.40H |
| 7.57 | 7.66 | 7.68 | 7.69 | 7.73 | 7.77 | 7.79 | 7.79 | 7.81 | 7.82 |