| Start Page |
|
 |
| Start Page |
|
|
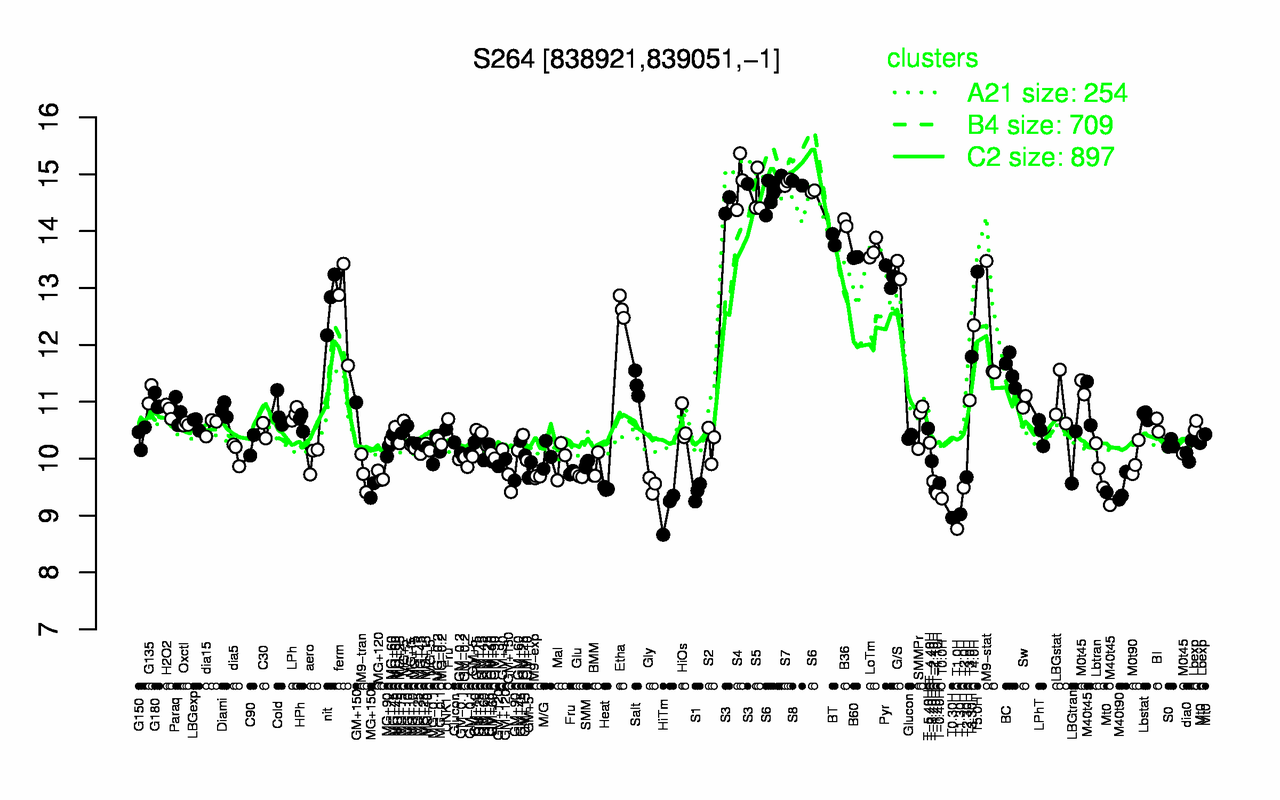
| S4 | S7 | S8 | S6 | S5 | S3 | B36 | BT | LoTm | B60 |
| 14.9 | 14.9 | 14.8 | 14.7 | 14.6 | 14.6 | 14.1 | 13.9 | 13.7 | 13.5 |
| T1.0H | T0.30H | T1.30H | HiTm | T0.0H | T-1.10H | S1 | T-1.40H | MG+150 | M40t90 |
| 8.77 | 8.96 | 9.02 | 9.09 | 9.3 | 9.38 | 9.41 | 9.44 | 9.44 | 9.47 |