| Start Page |
|
 |
| Start Page |
|
|
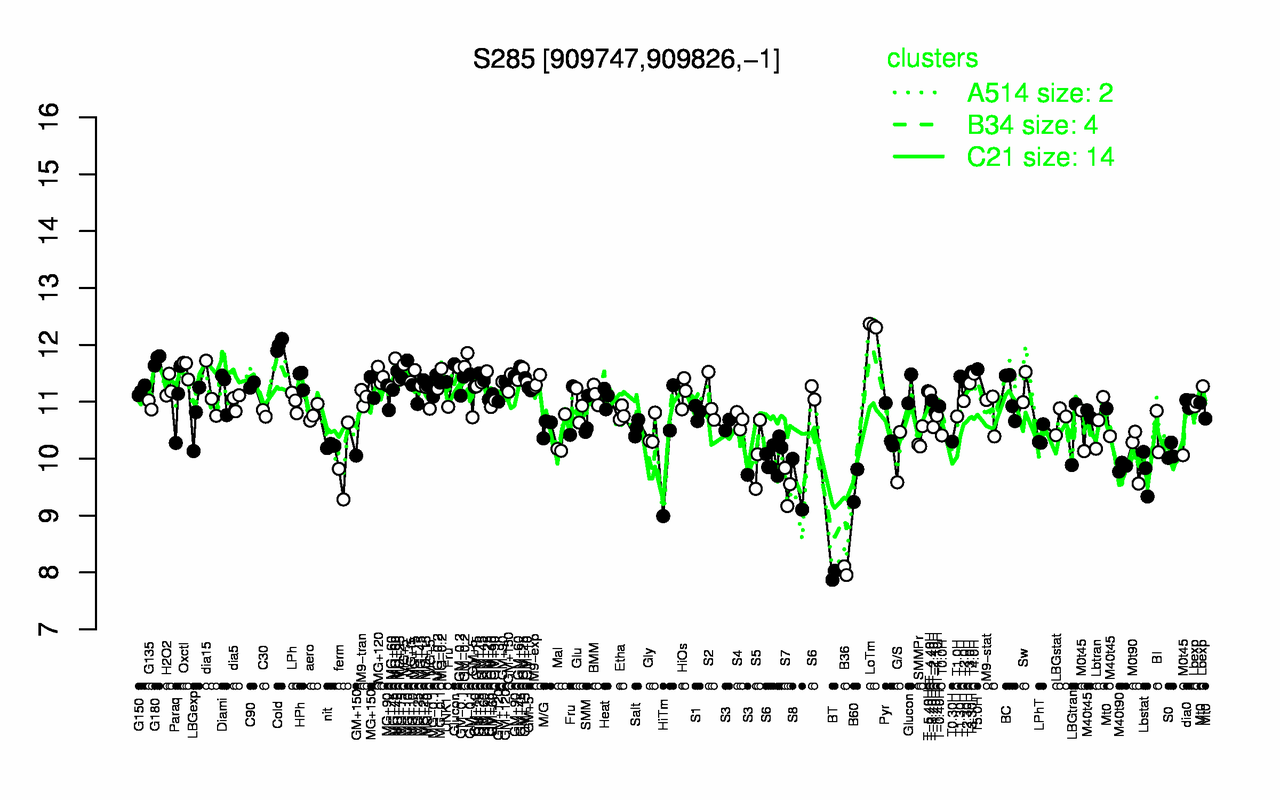
| LoTm | Cold | G180 | GM-0.2 | Oxctl | T5.0H | GM+25 | T3.30H | MG+60 | T4.0H |
| 12.3 | 12 | 11.7 | 11.7 | 11.6 | 11.6 | 11.5 | 11.5 | 11.5 | 11.5 |
| BT | B36 | S7 | B60 | S8 | Lbstat | M40t90 | ferm | G/S | S5 |
| 7.95 | 8.03 | 9.52 | 9.52 | 9.55 | 9.76 | 9.86 | 9.91 | 10 | 10.1 |