B. subtilis Expression Data Browser
Start Page
B. subtilis Expression Data Browser
Gene/Segment:
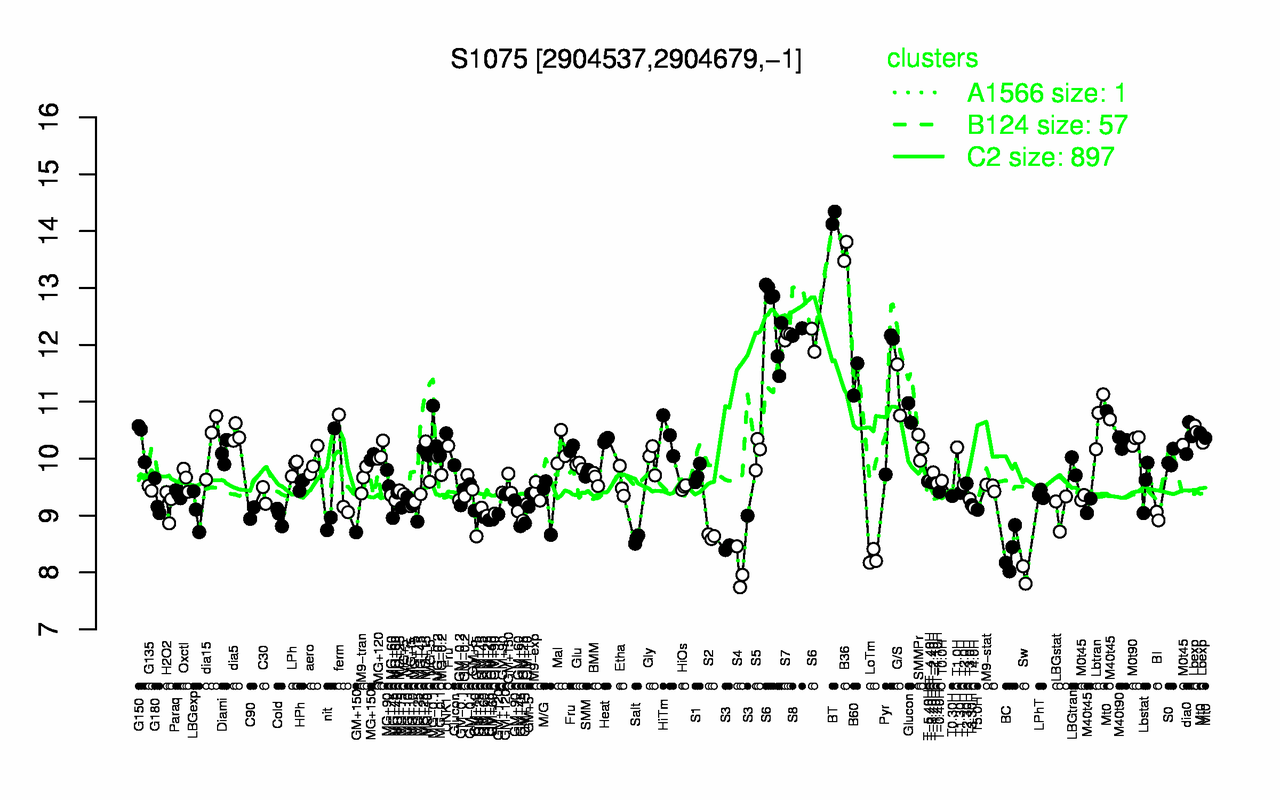
S1075
Locus Tag:
new_2904537_2904679_c
Details about S1075
Show/Hide
Highest Expression Conditions
BT
B36
S6
S8
S7
B60
Pyr
G/S
Lbtran
Mt0
14.2
13.6
12.4
12.2
12.2
11.4
11.3
11.2
10.7
10.5
Lowest Expression Conditions
Sw
S4
LoTm
BC
Salt
S3
S2
GM+15
GM+45
Cold
7.96
8.05
8.26
8.37
8.59
8.62
8.63
8.81
8.96
8.99
Most Positively Correlated Segments
gerE
cotS
cotSA
S729
yfnE
spsI
spsF
S1385
yodN
ydzH
0.88
0.79
0.79
0.77
0.77
0.77
0.77
0.77
0.77
0.77
Most Negatively Correlated Segments
ccpB
padR
exoA
ycbG
rnhC
kinD
ftsR
S285
ywqC
yabR
-0.69
-0.62
-0.59
-0.59
-0.59
-0.58
-0.58
-0.58
-0.58
-0.58
Expression Profile of Segment S1075
Show/Hide
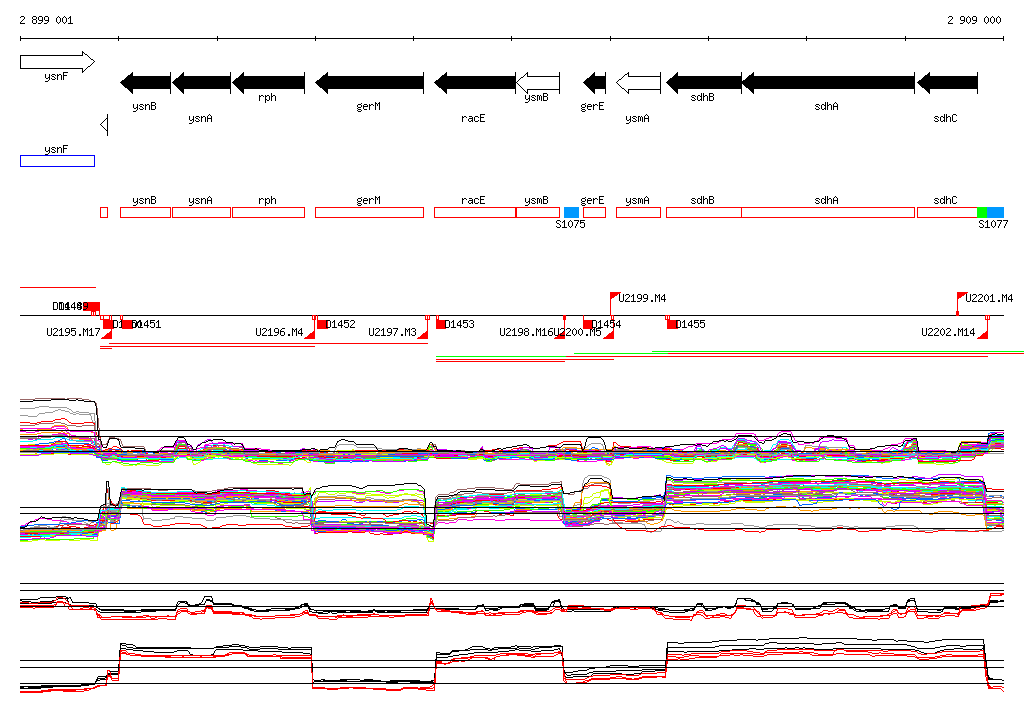
Genomic View of Gene/Segment S1075
Show/Hide
(Legend)
Browse Genome Context