B. subtilis Expression Data Browser
Start Page
B. subtilis Expression Data Browser
Gene/Segment:
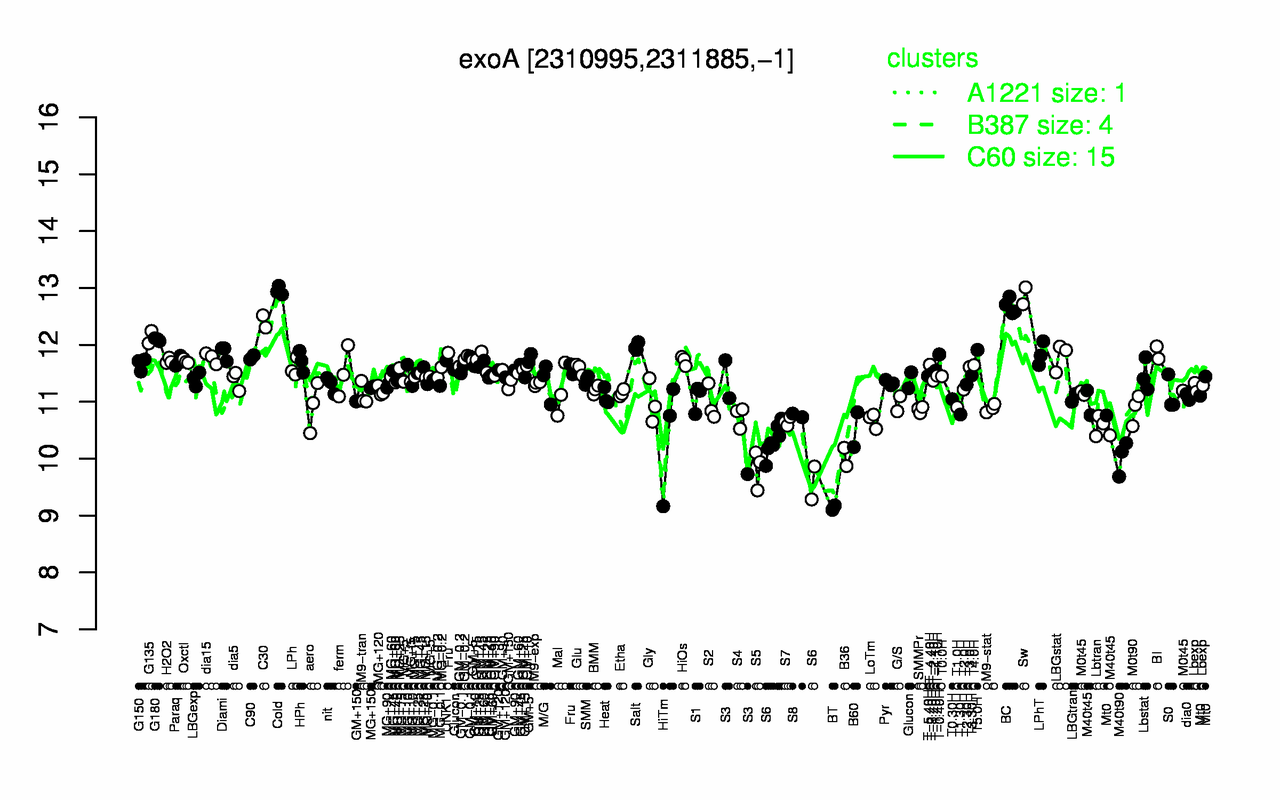
exoA
Locus Tag:
BSU22010
Details about exoA
Show/Hide
Highest Expression Conditions
Cold
Sw
BC
C30
G135
G180
Salt
T5.0H
BI
Diami
13
12.9
12.7
12.4
12.1
12.1
12
11.9
11.9
11.9
Lowest Expression Conditions
BT
S5
M40t90
B36
S6
HiTm
B60
Lbtran
S7
LoTm
9.14
9.83
10
10
10.2
10.4
10.5
10.6
10.7
10.7
Most Positively Correlated Segments
yshA
recF
yaaB
yshB
ispE
tagO
tagD
S1080
yaaA
yabB
0.75
0.75
0.73
0.73
0.72
0.71
0.71
0.7
0.7
0.69
Most Negatively Correlated Segments
gerE
S1075
yojB
S393
yotN
S1223
S1246
S1386
S388
ybbH
-0.61
-0.59
-0.59
-0.59
-0.58
-0.58
-0.58
-0.58
-0.58
-0.57
Expression Profile of Segment exoA
Show/Hide
Annotation of Gene exoA
Show/Hide
function
16.6: Maintain
function
16.9: Replicate
inference
ab initio prediction:AMIGene:2.0
codon_start
1
product
5'3'-exonuclease
transl_table
11
note
Evidence 1a: Function experimentally demonstrated in the studied strain; PubMedId: 16045613, 17038322, 17905985; Product type e: enzyme
db_xref
GI:2634620
protein_id
CAB14118.1
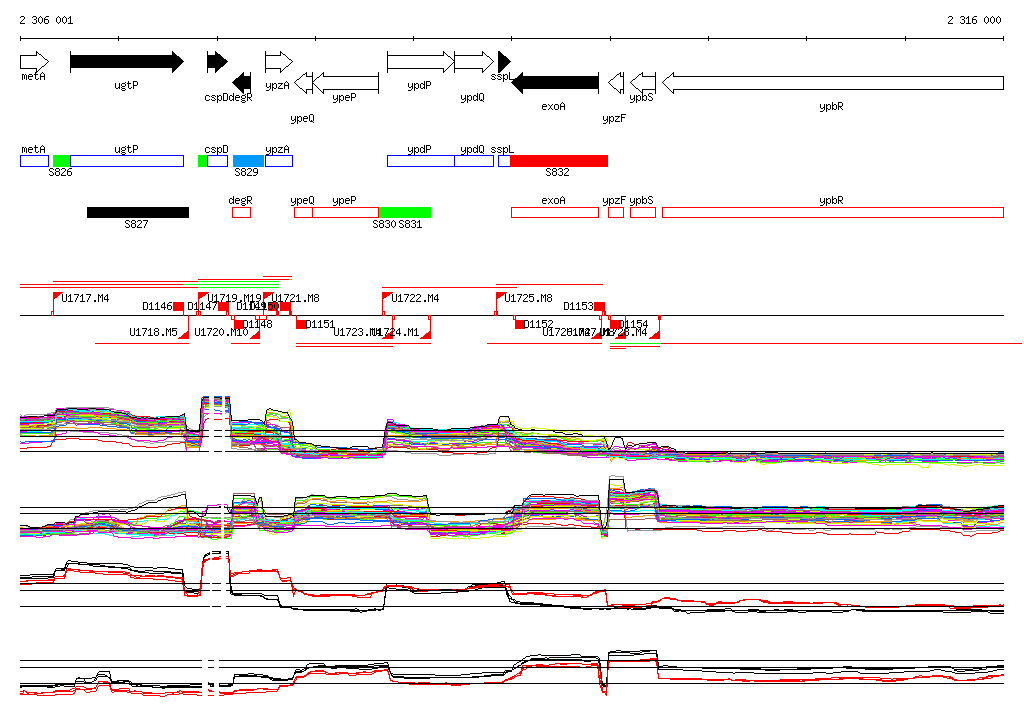
Genomic View of Gene/Segment exoA
Show/Hide
(Legend)
Browse Genome Context