| Start Page |
|
 |
| Start Page |
|
|
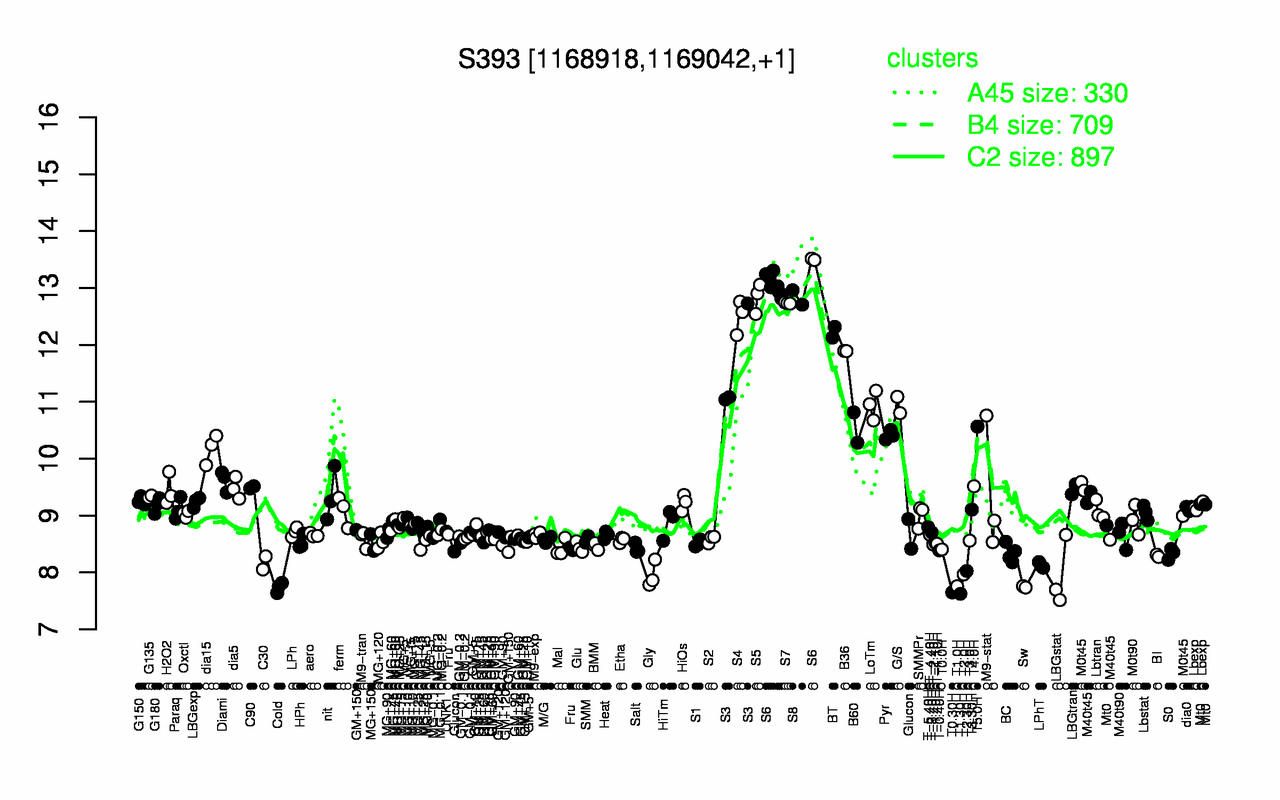
| S6 | S5 | S8 | S7 | S4 | BT | B36 | S3 | G/S | LoTm |
| 13.2 | 12.8 | 12.8 | 12.7 | 12.5 | 12.2 | 11.9 | 11.6 | 10.9 | 10.9 |
| T1.30H | T0.30H | Cold | Sw | T1.0H | Gly | LBGstat | T2.0H | T2.30H | LPhT |
| 7.63 | 7.65 | 7.74 | 7.75 | 7.76 | 7.96 | 7.96 | 7.97 | 8.02 | 8.13 |