| Start Page |
|
 |
| Start Page |
|
|
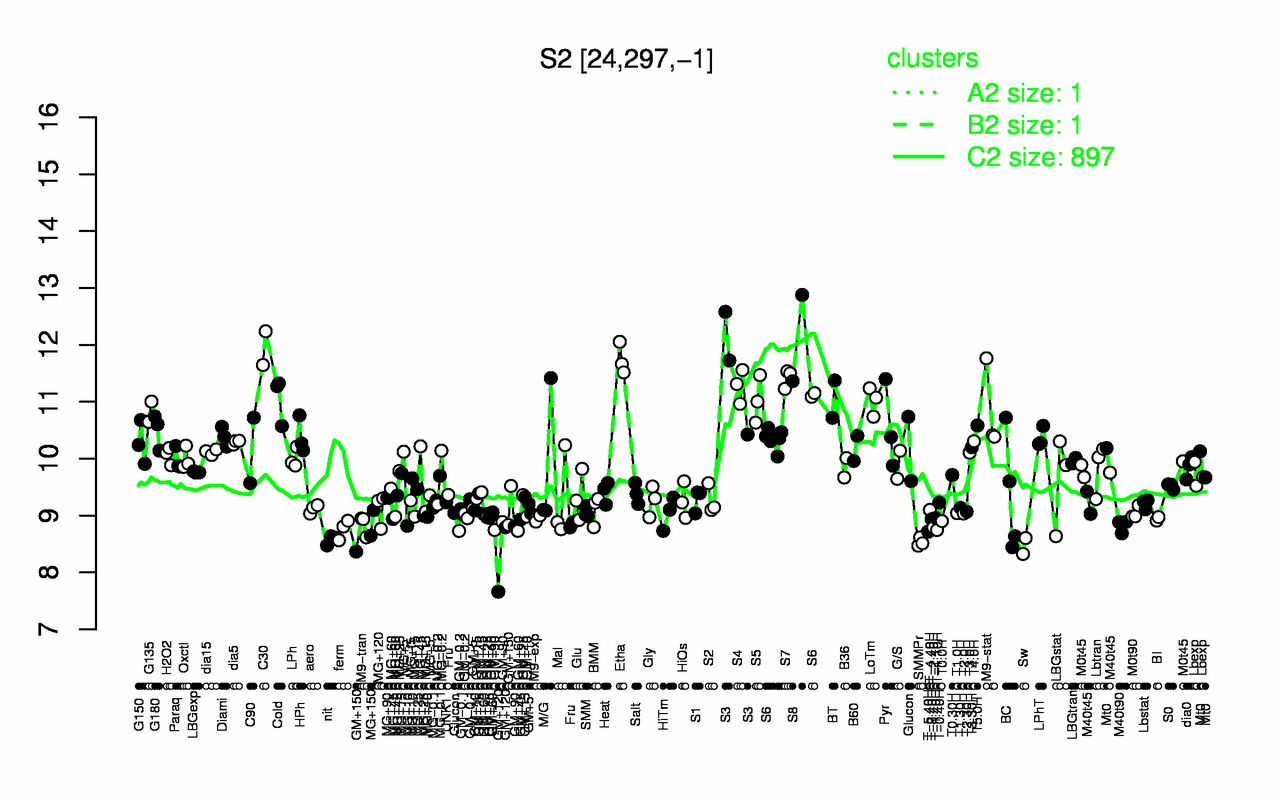
| S8 | C30 | Etha | S3 | S7 | S4 | Cold | BT | S5 | LoTm |
| 12.1 | 11.9 | 11.7 | 11.6 | 11.4 | 11.3 | 11.1 | 11 | 11 | 11 |
| GM+120 | Sw | SMMPr | nit | T-5.40H | T-1.10H | ferm | T-2.40H | GM+90 | M40t90 |
| 8.23 | 8.46 | 8.53 | 8.57 | 8.72 | 8.75 | 8.76 | 8.79 | 8.81 | 8.82 |