| Start Page |
|
 |
| Start Page |
|
|
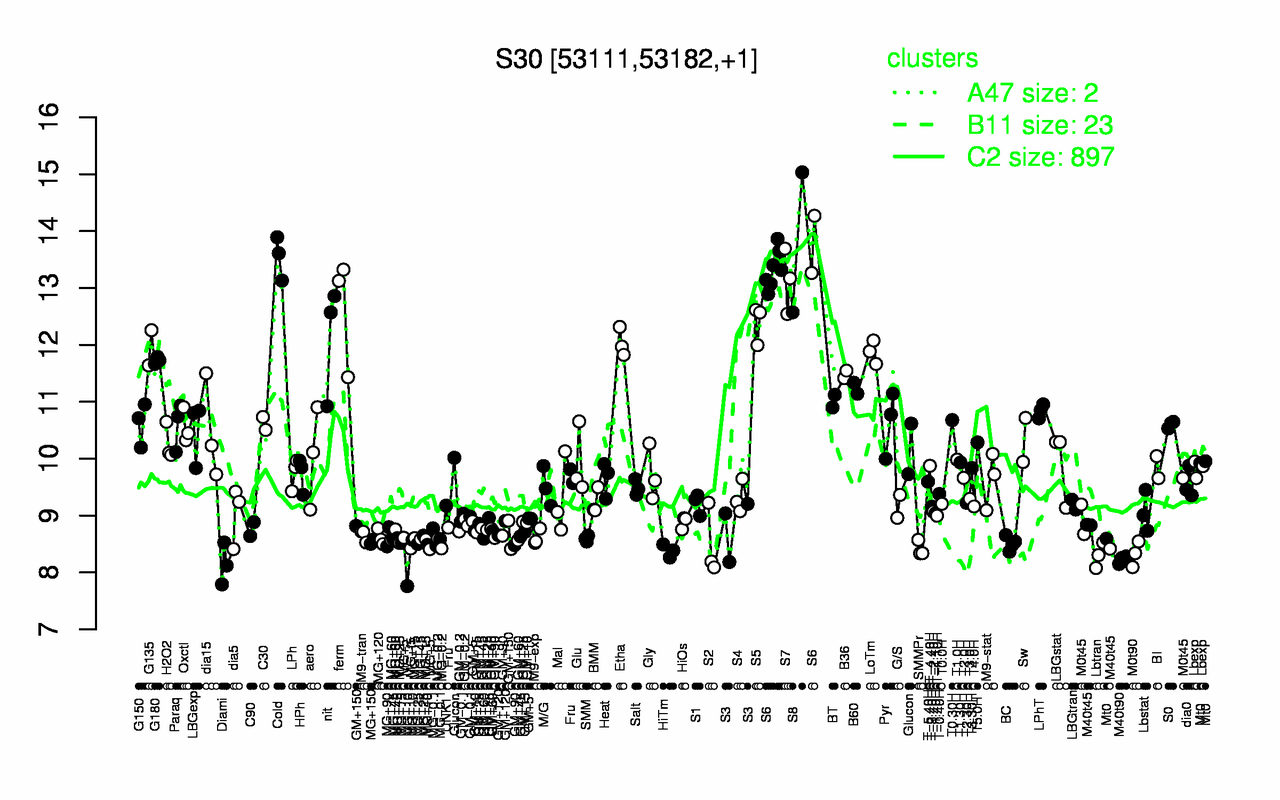
| S8 | Cold | S6 | S7 | ferm | S5 | nit | Etha | G135 | LoTm |
| 13.8 | 13.5 | 13.4 | 13.1 | 12.6 | 12.4 | 12.1 | 12 | 11.9 | 11.9 |
| Diami | M40t90 | MG+10 | Lbtran | M0t90 | HiTm | SMMPr | MG+t5 | S2 | MG-0.2 |
| 8.15 | 8.23 | 8.27 | 8.3 | 8.33 | 8.38 | 8.42 | 8.42 | 8.5 | 8.51 |