B. subtilis Expression Data Browser
Start Page
B. subtilis Expression Data Browser
Gene/Segment:
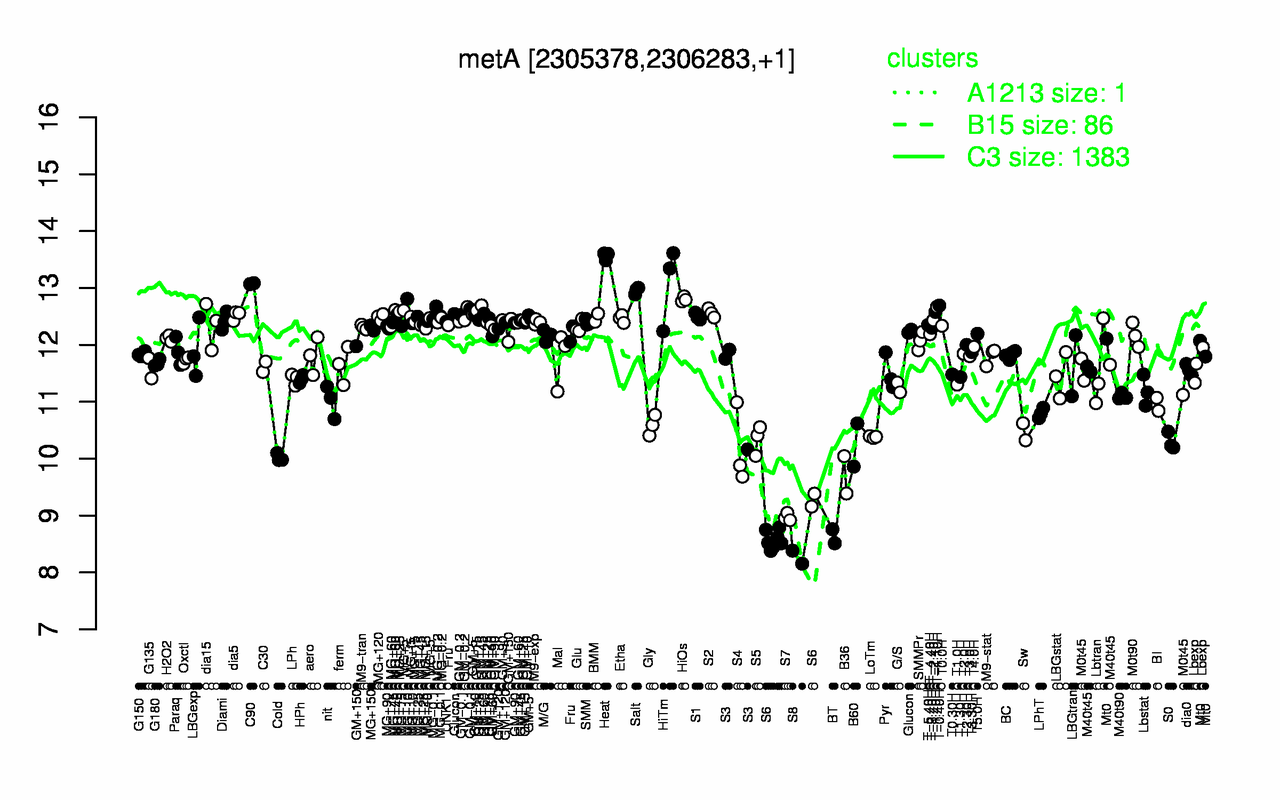
metA
Locus Tag:
BSU21910
Details about metA
Show/Hide
Highest Expression Conditions
Heat
C90
HiTm
Salt
HiOs
T-0.40H
T-1.10H
T-1.40H
S2
GM-0.1
13.6
13.1
13.1
13
12.8
12.7
12.7
12.6
12.6
12.6
Lowest Expression Conditions
S8
BT
S6
S7
B36
Cold
S4
B60
S0
S5
8.27
8.64
8.73
8.97
9.72
10
10.2
10.2
10.3
10.3
Most Positively Correlated Segments
penP
S149
ykuH
ftsW
ywdD
S1126
S511
yqhM
ydeO
cheR
0.83
0.82
0.8
0.8
0.79
0.79
0.79
0.78
0.77
0.77
Most Negatively Correlated Segments
yrbD
S477
S1303
ykoP
yvdP
yrkC
S1062
fadM
yetF
S388
-0.81
-0.8
-0.8
-0.8
-0.79
-0.78
-0.78
-0.78
-0.78
-0.78
Expression Profile of Segment metA
Show/Hide
Annotation of Gene metA
Show/Hide
function
16.2: Construct biomass (Anabolism)
inference
ab initio prediction:AMIGene:2.0
codon_start
1
EC_number
2.3.1.-
transl_table
11
note
Evidence 3: Function proposed based on presence of conserved amino acid motif, structural feature or limited homology; PubMedId: 10939241, 11832514, 17056751, 5001847; Product type e: enzyme
db_xref
GI:225185107
product
putative homoserine O-acetyltransferase
protein_id
CAB14109.2
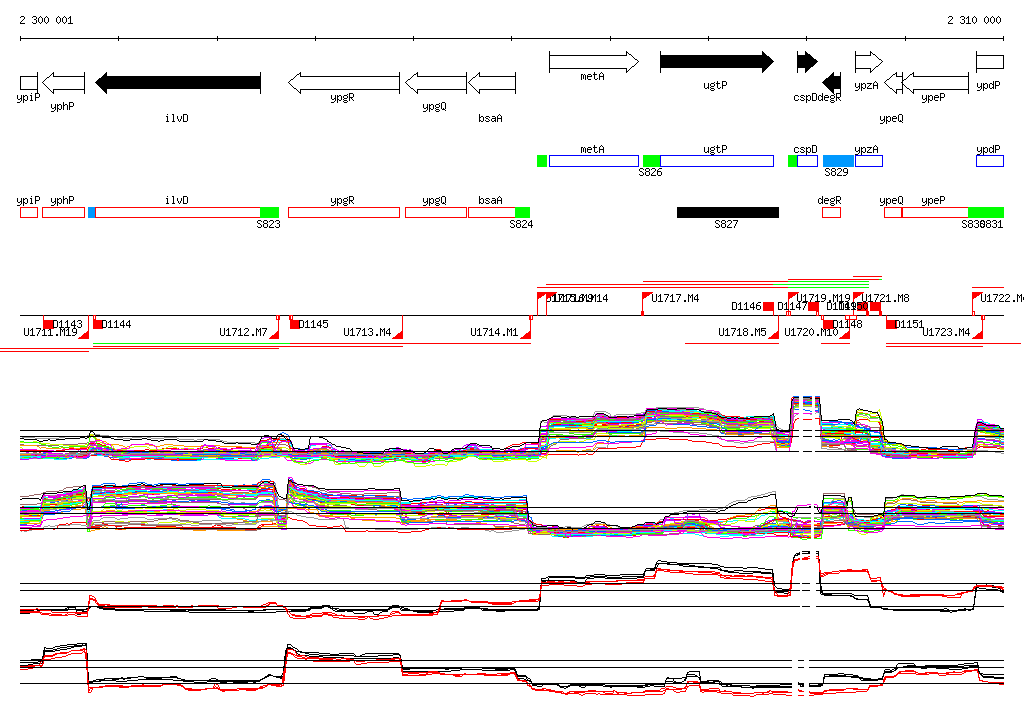
Genomic View of Gene/Segment metA
Show/Hide
(Legend)
Browse Genome Context