B. subtilis Expression Data Browser
Details about S320 Show/Hide
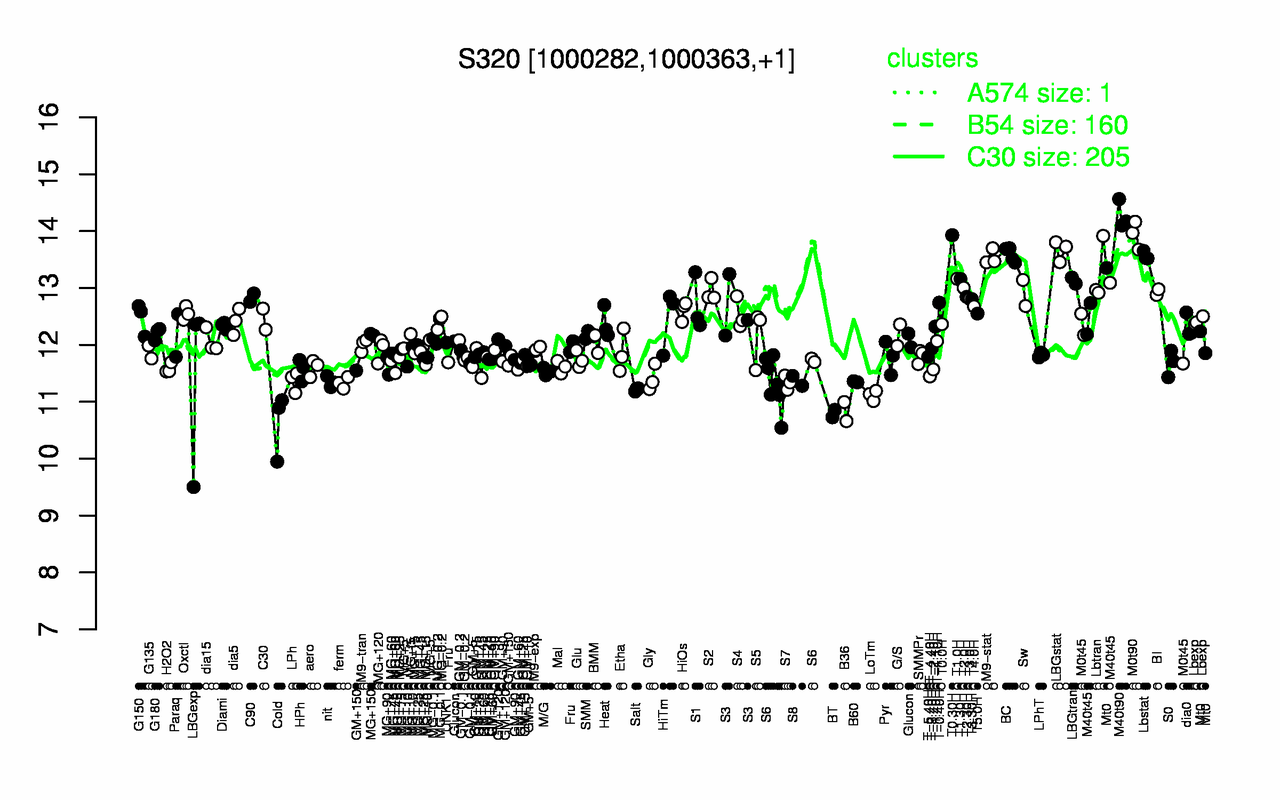
Highest Expression Conditions
M40t90 M0t90 T0.30H LBGstat BC Lbstat M9-stat Lbtran T1.0H T1.30H
14.3 13.9 13.9 13.7 13.6 13.6 13.5 13.3 13.2 13.2
Lowest Expression Conditions
Cold BT B36 LoTm Salt ferm S7 nit B60 LPh
10.6 10.8 10.8 11.1 11.2 11.3 11.3 11.3 11.4 11.4
Most Positively Correlated Segments
yhxA glpP xsa yxkF licT yncC S637 yfiG S1526 yizB
0.85 0.75 0.7 0.7 0.7 0.68 0.67 0.67 0.67 0.67
Most Negatively Correlated Segments
S1055 yxlA ytbQ purA coxA S1154 nadB nadC bioYB bioK
-0.59 -0.56 -0.54 -0.54 -0.53 -0.53 -0.53 -0.53 -0.52 -0.52
Expression Profile of Segment S320 Show/Hide
Genomic View of Gene/Segment S320 Show/Hide
(Legend)