| Start Page |
|
 |
| Start Page |
|
|
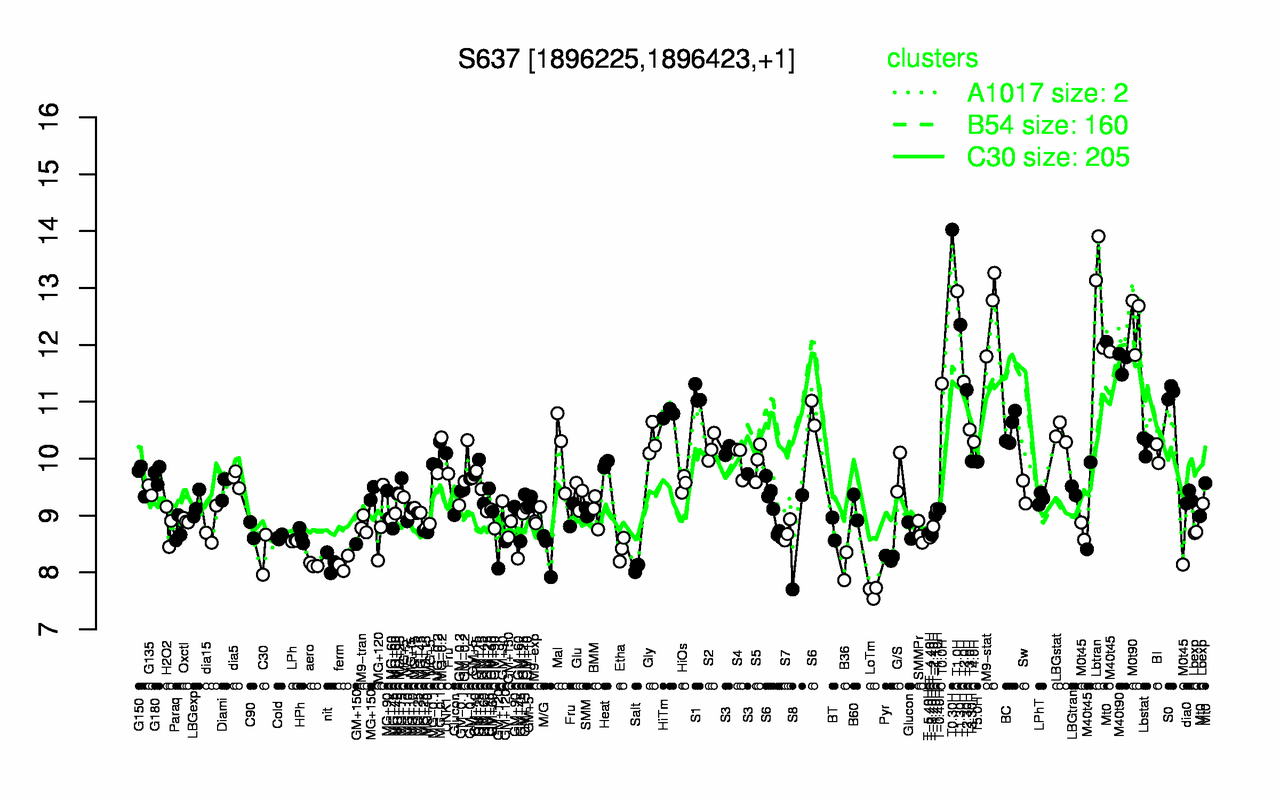
| T0.30H | Lbtran | T1.0H | M9-stat | M0t90 | T1.30H | M40t90 | T2.0H | T0.0H | T2.30H |
| 14 | 13 | 12.9 | 12.6 | 12.4 | 12.4 | 11.7 | 11.4 | 11.3 | 11.2 |
| LoTm | Salt | B36 | aero | ferm | nit | Pyr | GM+120 | C30 | M/G |
| 7.66 | 8.09 | 8.11 | 8.13 | 8.15 | 8.17 | 8.26 | 8.31 | 8.31 | 8.37 |