| Start Page |
|
 |
| Start Page |
|
|
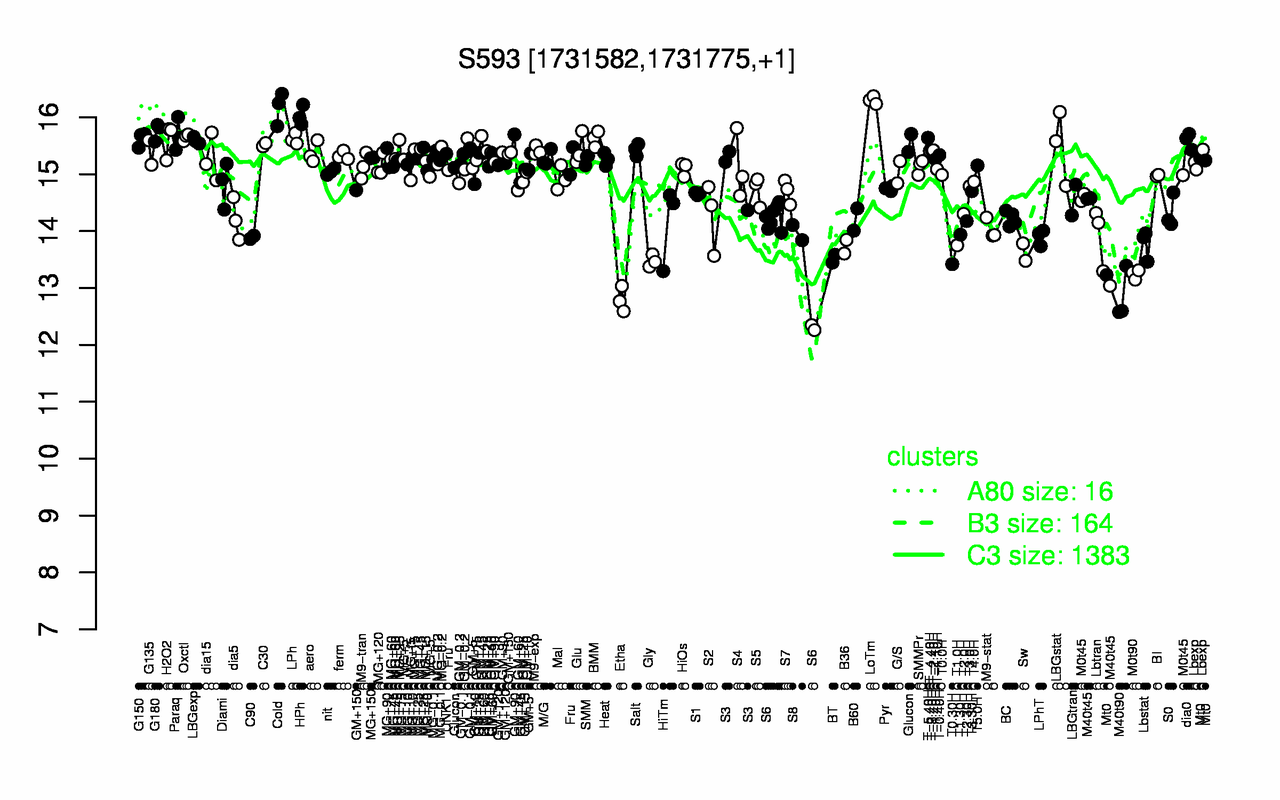
| LoTm | Cold | HPh | G180 | Paraq | Oxctl | T-5.40H | BMM | G150 | LPh |
| 16.3 | 16.2 | 16 | 15.8 | 15.7 | 15.7 | 15.6 | 15.6 | 15.6 | 15.6 |
| Etha | M40t90 | M0t90 | T0.30H | Gly | BT | Sw | B36 | T1.0H | Lbstat |
| 12.8 | 12.9 | 13.2 | 13.4 | 13.5 | 13.5 | 13.6 | 13.7 | 13.7 | 13.8 |