| Start Page |
|
 |
| Start Page |
|
|
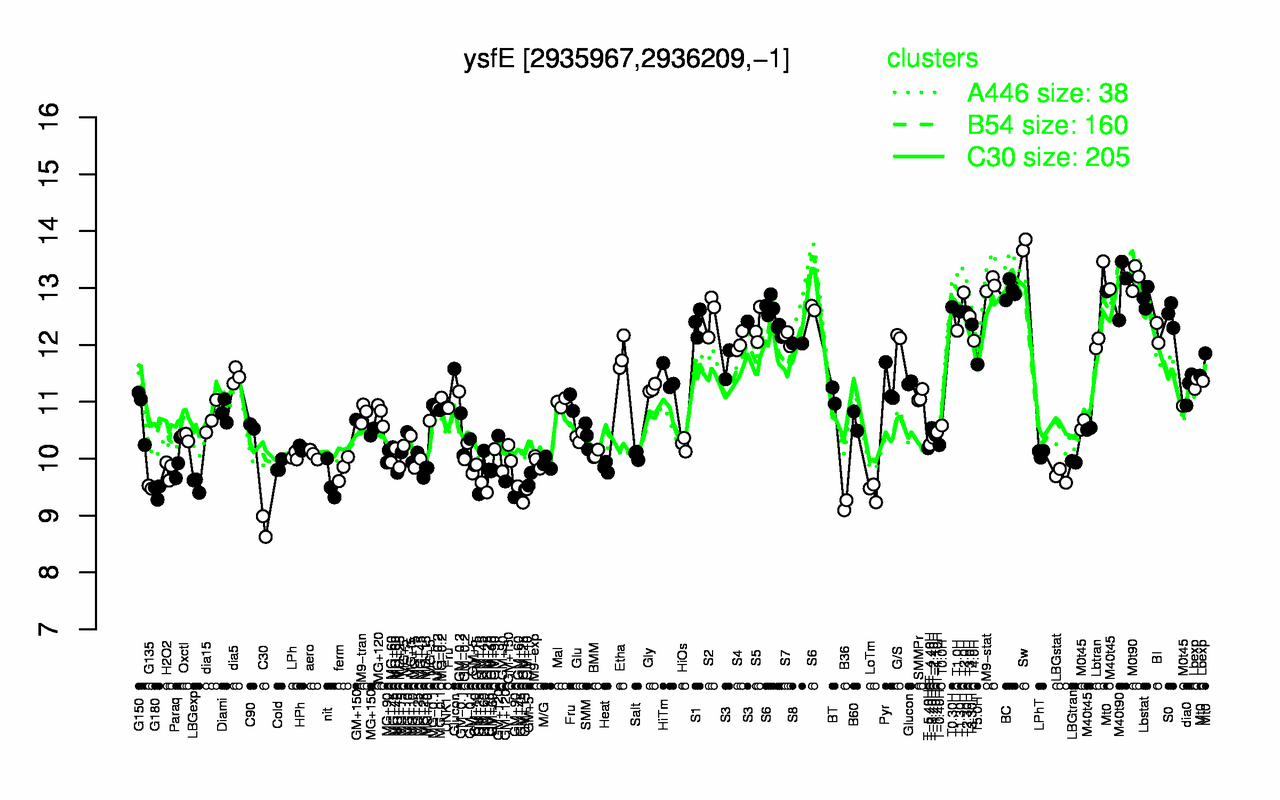
| Sw | M0t90 | M9-stat | M40t90 | BC | T2.0H | Lbstat | T0.30H | T1.30H | T2.30H |
| 13.8 | 13.2 | 13.1 | 13 | 13 | 12.9 | 12.8 | 12.7 | 12.6 | 12.6 |
| C30 | B36 | GM+25 | LoTm | G180 | G135 | LBGexp | GM+45 | nit | GM+5 |
| 8.81 | 9.18 | 9.34 | 9.42 | 9.43 | 9.5 | 9.55 | 9.56 | 9.61 | 9.67 |