| Start Page |
|
 |
| Start Page |
|
|
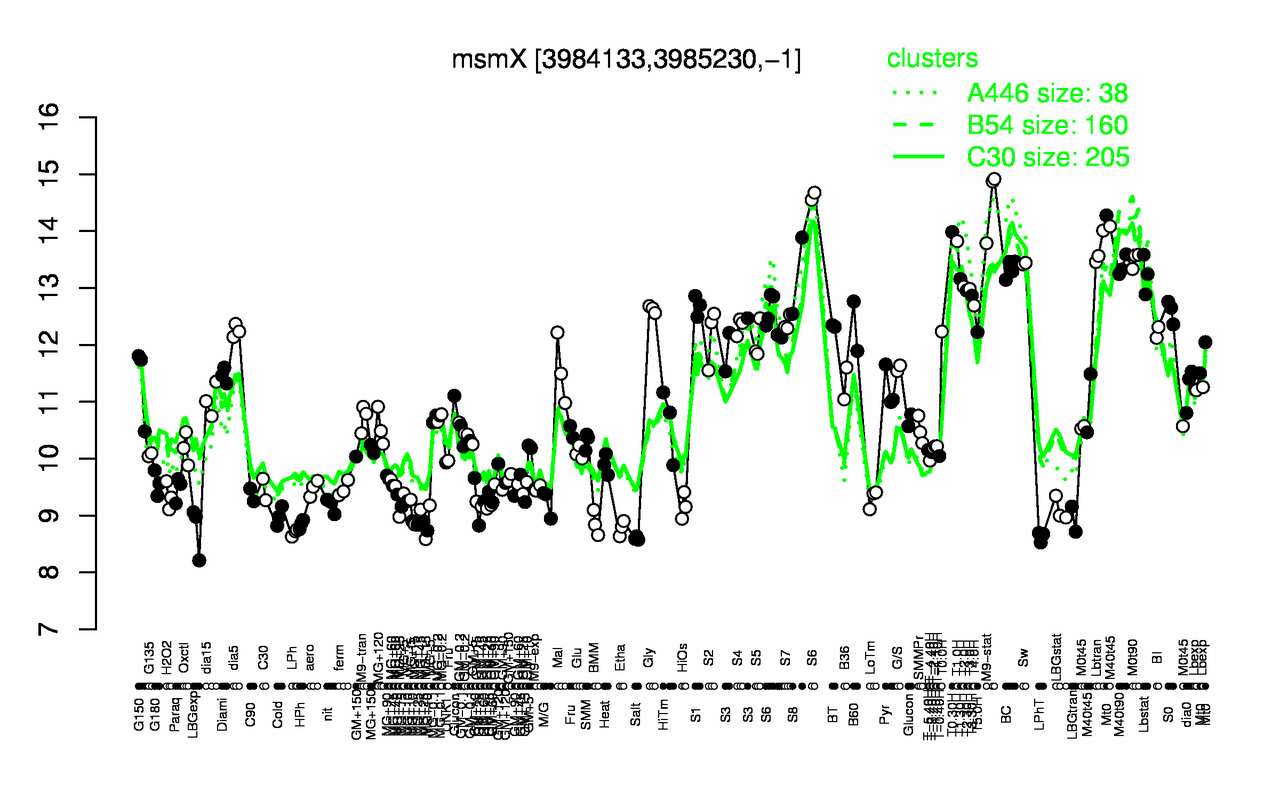
| M9-stat | T0.30H | T1.0H | Lbtran | M0t90 | Sw | M40t90 | BC | Lbstat | S8 |
| 14.5 | 14 | 13.8 | 13.7 | 13.5 | 13.4 | 13.4 | 13.3 | 13.2 | 13.2 |
| Salt | LPhT | LPh | LBGexp | Etha | HPh | MG+15 | BMM | MG+25 | LBGtran |
| 8.6 | 8.63 | 8.7 | 8.75 | 8.78 | 8.85 | 8.86 | 8.87 | 8.9 | 8.94 |