| Start Page |
|
 |
| Start Page |
|
|
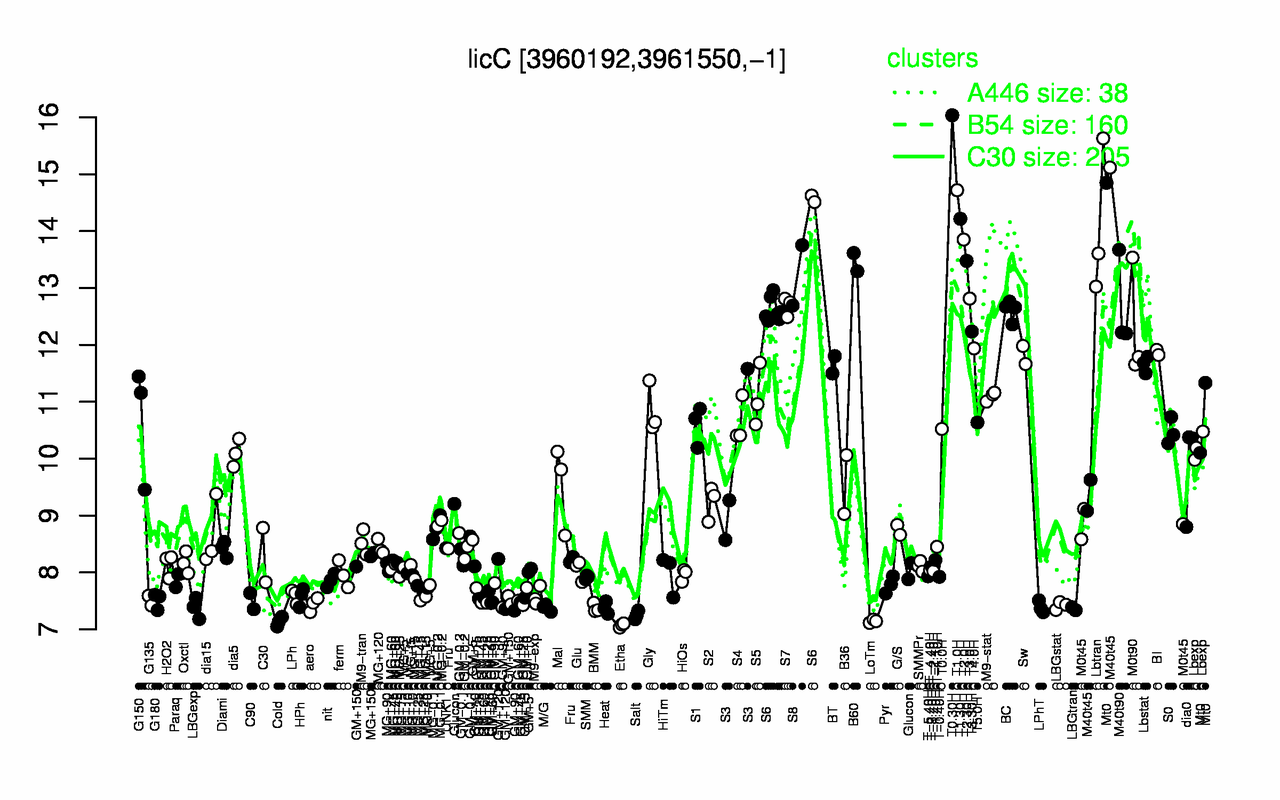
| T0.30H | T1.0H | T1.30H | Lbtran | T2.0H | T2.30H | B60 | S8 | S6 | T3.0H |
| 16 | 14.7 | 14.2 | 14.1 | 13.9 | 13.5 | 13.5 | 13.2 | 13 | 12.8 |
| Etha | Cold | LoTm | Salt | LBGtran | LBGexp | BMM | Heat | M/G | LPhT |
| 7.07 | 7.13 | 7.14 | 7.25 | 7.36 | 7.38 | 7.38 | 7.38 | 7.38 | 7.39 |