| Start Page |
|
 |
| Start Page |
|
|
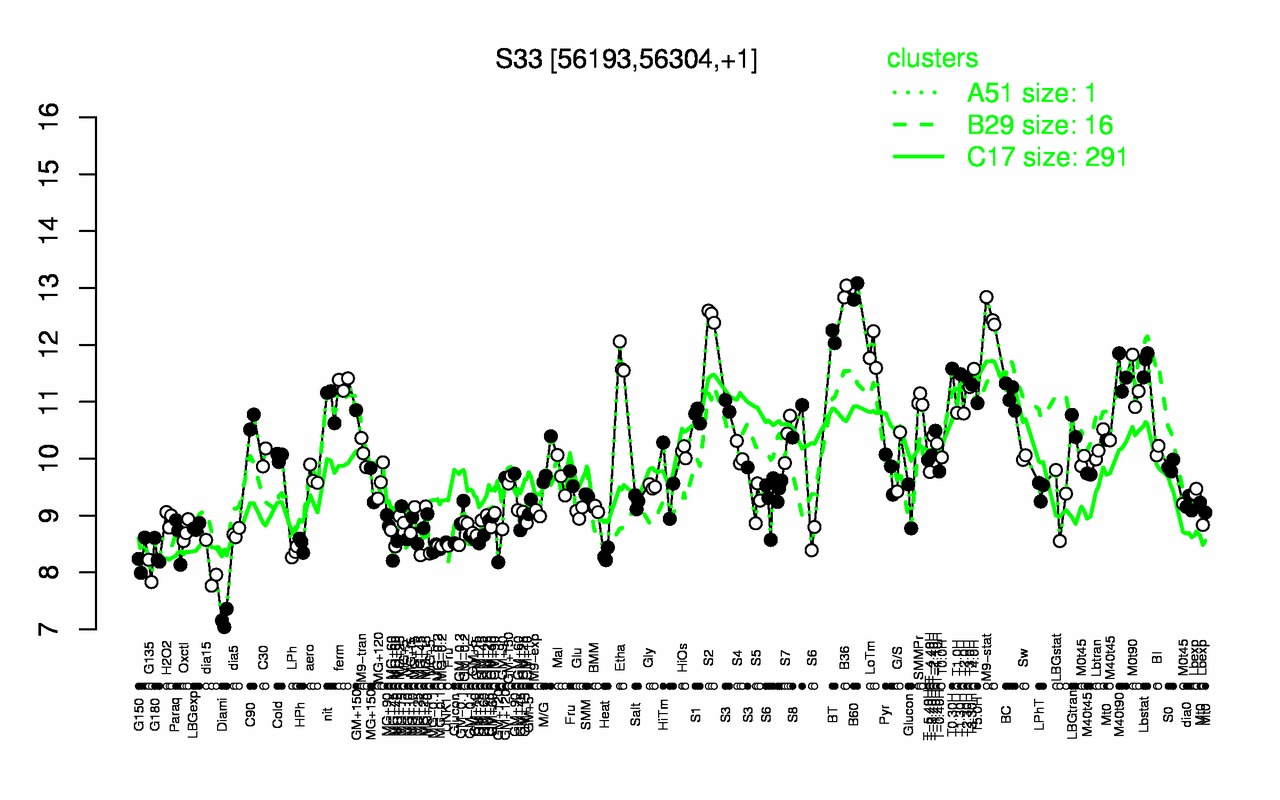
| B60 | B36 | M9-stat | S2 | BT | LoTm | Etha | Lbstat | T0.30H | T4.0H |
| 12.9 | 12.9 | 12.5 | 12.5 | 12.1 | 11.9 | 11.7 | 11.7 | 11.6 | 11.6 |
| Diami | G135 | dia15 | G150 | Heat | G180 | MG+45 | LPh | MG-0.1 | MG-0.2 |
| 7.18 | 8.03 | 8.1 | 8.28 | 8.31 | 8.34 | 8.35 | 8.36 | 8.42 | 8.47 |