| Start Page |
|
 |
| Start Page |
|
|
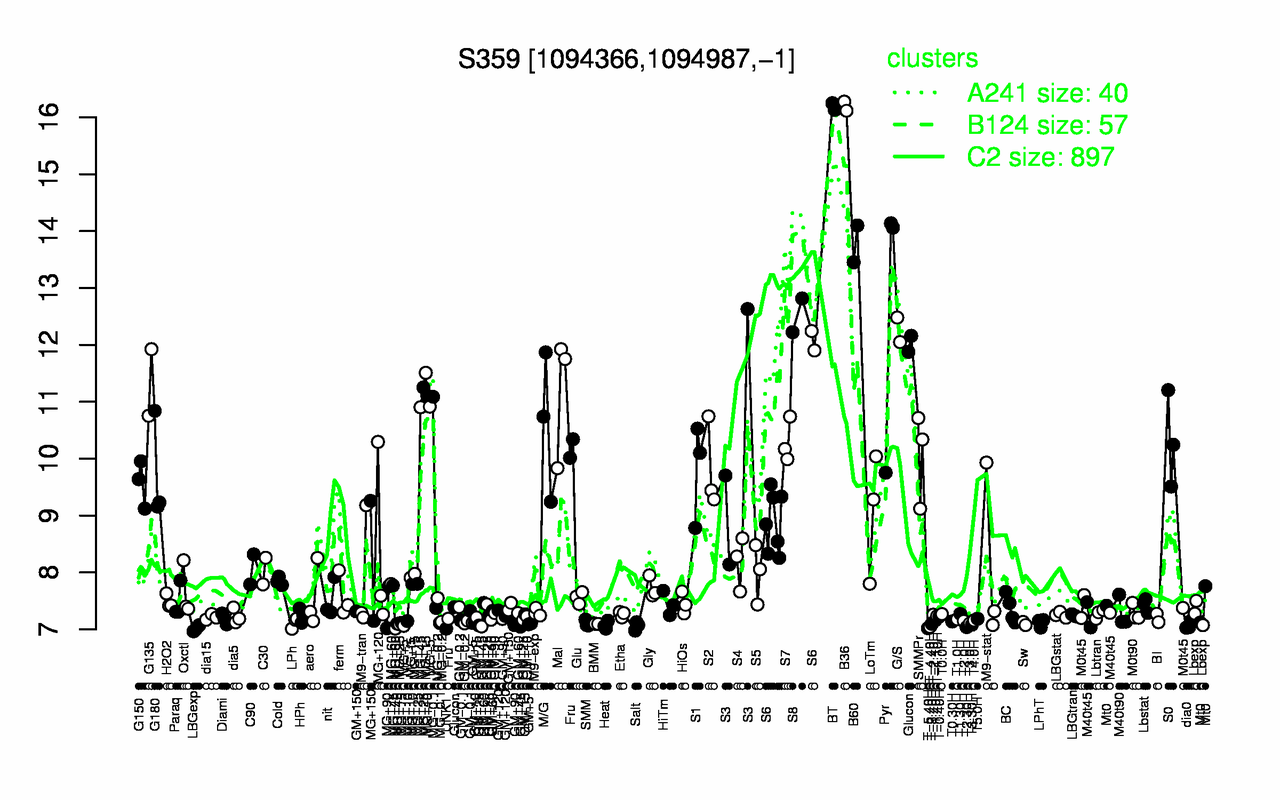
| B36 | BT | B60 | Pyr | S8 | G/S | G135 | Mal | M/G | Glucon |
| 16.2 | 16.2 | 13.8 | 12.7 | 12.5 | 12.3 | 11.3 | 11.2 | 10.6 | 10.5 |
| UNK1 | LBGexp | T-5.40H | T2.30H | T-4.40H | Salt | Heat | dia0 | T3.30H | GM+45 |
| 7.01 | 7.01 | 7.02 | 7.04 | 7.04 | 7.06 | 7.07 | 7.08 | 7.08 | 7.09 |