| Start Page |
|
 |
| Start Page |
|
|
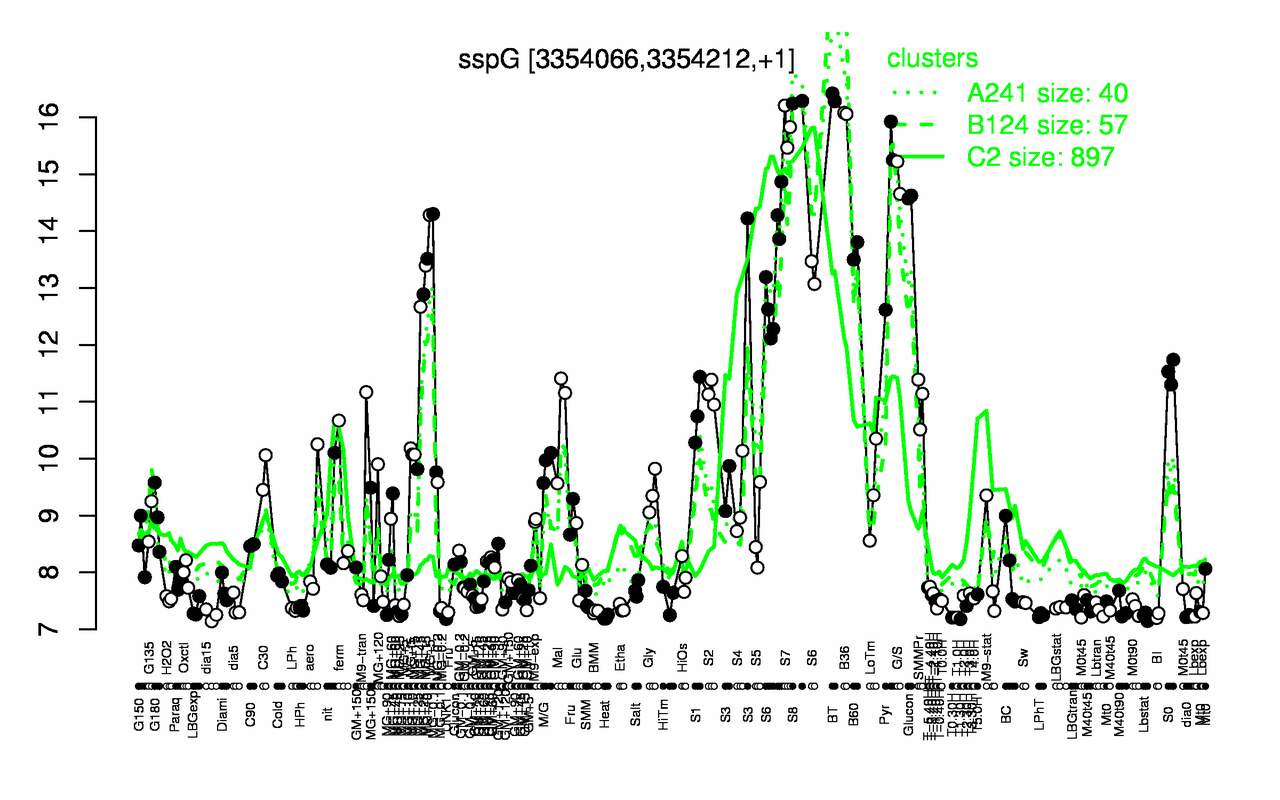
| BT | S8 | B36 | S7 | G/S | Pyr | B60 | S6 | Glucon | S0 |
| 16.4 | 16.3 | 16.1 | 15.8 | 14.9 | 14.6 | 13.7 | 13.3 | 12.4 | 11.5 |
| T1.30H | UNK1 | T0.30H | T1.0H | Heat | Lbstat | dia0 | BI | LPhT | dia15 |
| 7.18 | 7.18 | 7.21 | 7.21 | 7.21 | 7.23 | 7.23 | 7.24 | 7.25 | 7.25 |