B. subtilis Expression Data Browser
Start Page
B. subtilis Expression Data Browser
Gene/Segment:
cotG
Locus Tag:
BSU36070
Details about cotG
Show/Hide
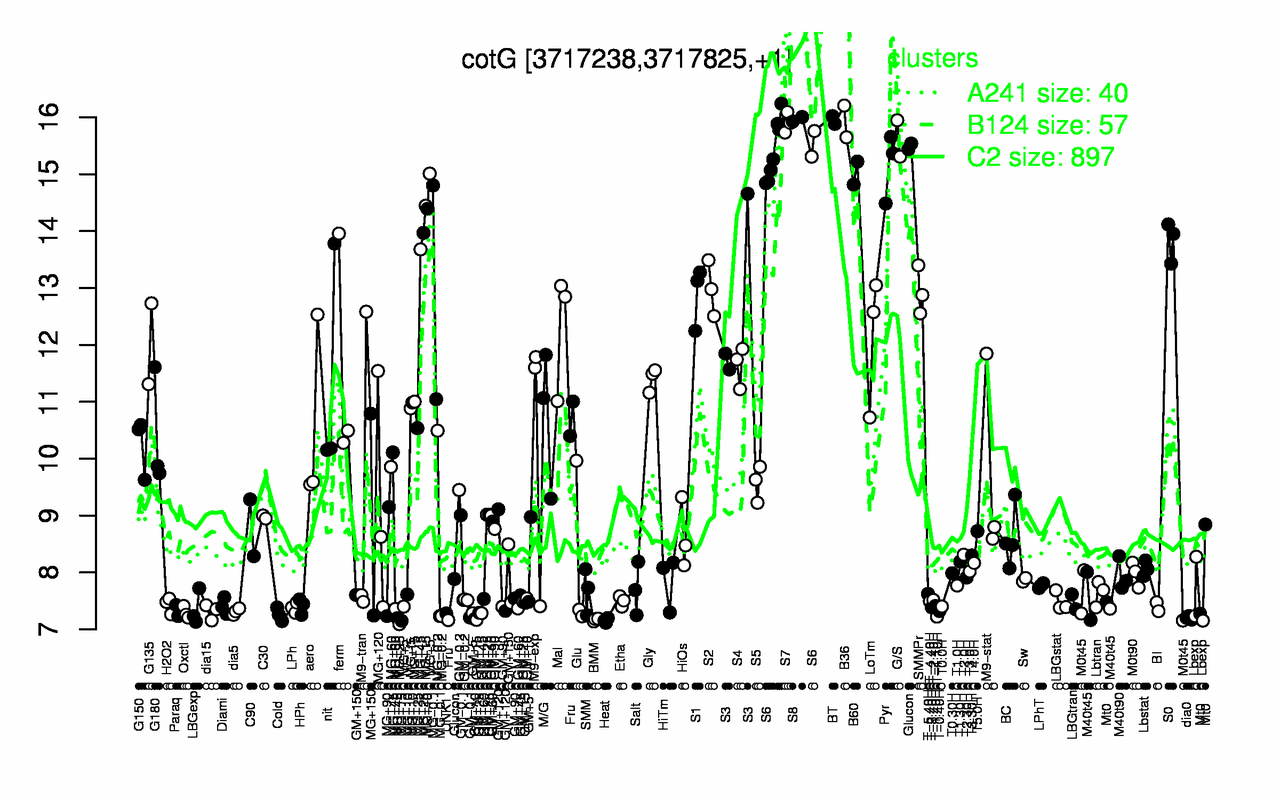
Highest Expression Conditions
S8
BT
B36
S7
G/S
S6
Pyr
B60
S0
S2
16
16
15.9
15.9
15.6
15.4
15.2
15
13.8
13
Lowest Expression Conditions
Heat
BMM
dia0
T-1.10H
Cold
UNK1
Oxctl
dia15
dia5
T-0.40H
7.16
7.17
7.2
7.22
7.26
7.28
7.29
7.31
7.31
7.32
Most Positively Correlated Segments
cgeA
yjcZ
sspG
S424
yurS
cotX
yczN
cgeB
spoVIF
cotV
0.96
0.95
0.94
0.94
0.93
0.92
0.92
0.92
0.92
0.91
Most Negatively Correlated Segments
ydcG
yqjP
ydhC
ydeM
polYA
aroC
ydfL
sigZ
yhjP
moeB
-0.7
-0.69
-0.69
-0.68
-0.68
-0.68
-0.68
-0.67
-0.67
-0.67
Expression Profile of Segment cotG
Show/Hide
Annotation of Gene cotG
Show/Hide
function
16.13: Shape
function
16.8: Protect
inference
ab initio prediction:AMIGene:2.0
codon_start
1
product
spore morphogenetic protein
transl_table
11
note
Evidence 1a: Function experimentally demonstrated in the studied strain; PubMedId: 11737650, 14762006, 15621419; Product type cp: cell process
db_xref
GI:2636132
protein_id
CAB15624.1
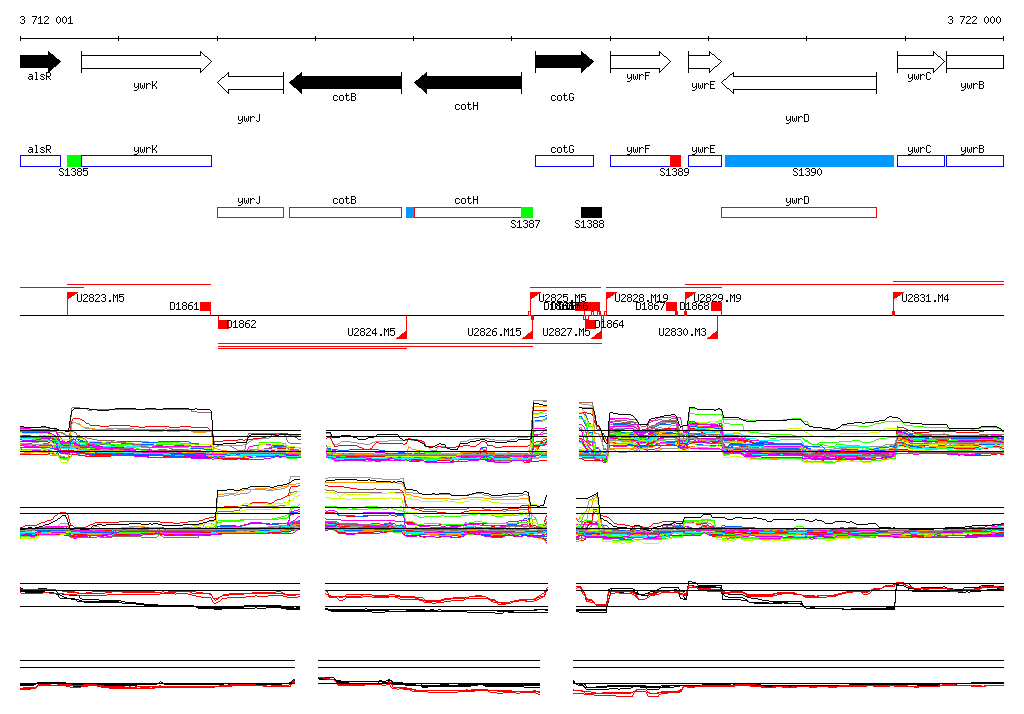
Genomic View of Gene/Segment cotG
Show/Hide
(Legend)
Browse Genome Context