| Start Page |
|
 |
| Start Page |
|
|
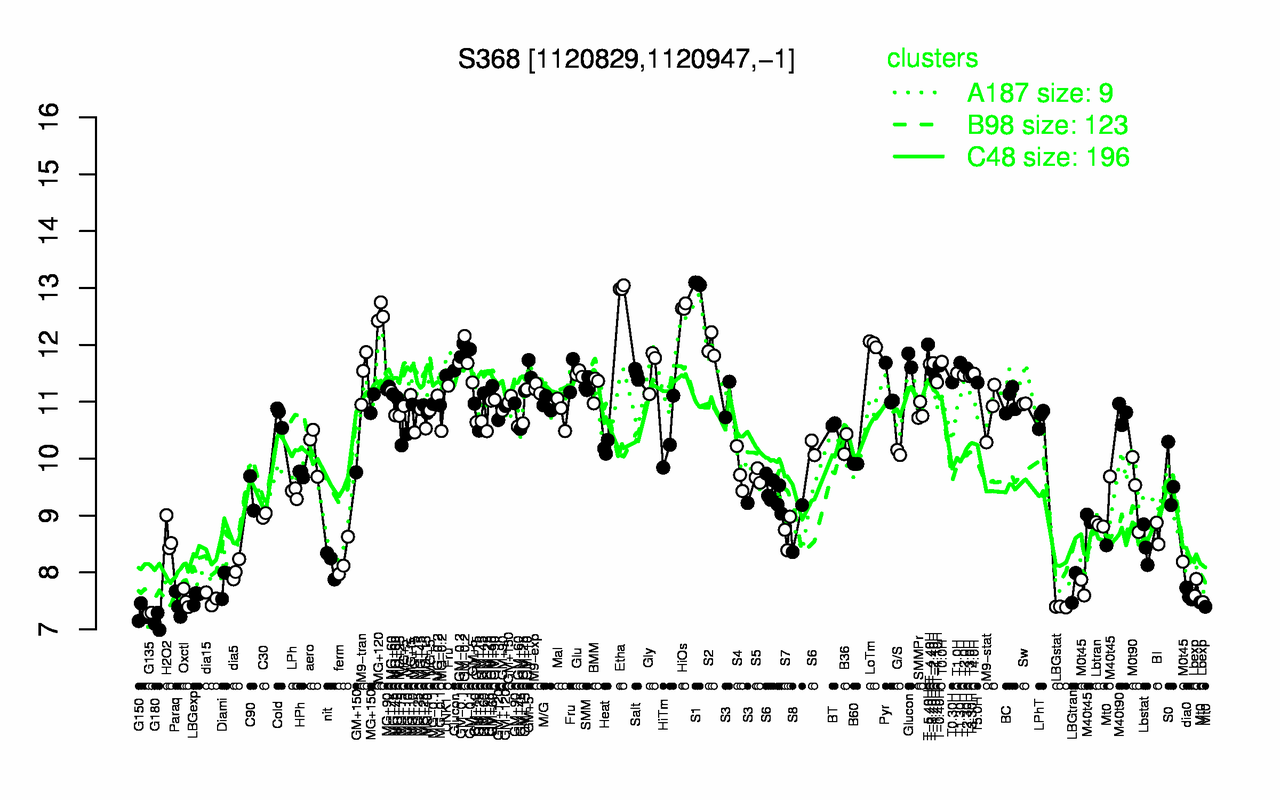
| S1 | Etha | HiOs | MG+120 | LoTm | T-5.40H | S2 | GM-0.1 | GM-0.2 | T0.0H |
| 13.1 | 13 | 12.7 | 12.6 | 12 | 12 | 12 | 11.9 | 11.8 | 11.7 |
| G180 | G150 | G135 | LBGstat | Paraq | Oxctl | dia15 | LBGexp | dia0 | Lbexp |
| 7.13 | 7.27 | 7.29 | 7.39 | 7.43 | 7.53 | 7.54 | 7.56 | 7.61 | 7.65 |