B. subtilis Expression Data Browser
Start Page
B. subtilis Expression Data Browser
Gene/Segment:
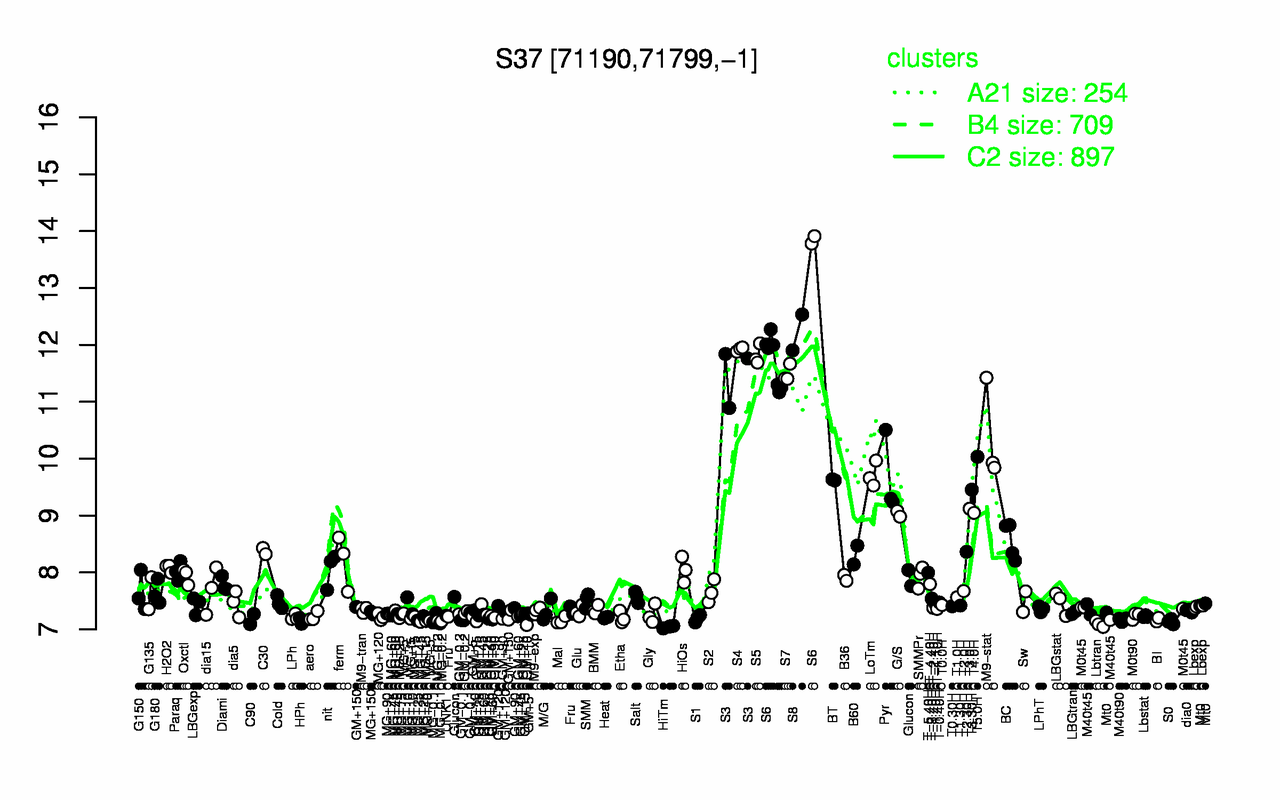
S37
Locus Tag:
new_71190_71799_c
Details about S37
Show/Hide
Highest Expression Conditions
S8
S6
S4
S5
S3
S7
M9-stat
T5.0H
LoTm
Pyr
12.2
12.2
11.9
11.8
11.5
11.5
10.4
10
9.72
9.68
Lowest Expression Conditions
HiTm
Lbtran
S0
MG-0.2
HPh
Mal
BI
M40t90
MG-0.1
C90
7.04
7.09
7.14
7.15
7.15
7.16
7.17
7.17
7.17
7.18
Most Positively Correlated Segments
S1505
citH
S1506
pbpG
S723
yyaC
yqhH
glnP
S745
glnM
0.97
0.97
0.97
0.96
0.96
0.96
0.96
0.96
0.96
0.96
Most Negatively Correlated Segments
sbcD
S378
kinC
yugH
yvrG
addA
yxkI
yceG
addB
sbcC
-0.88
-0.87
-0.87
-0.87
-0.86
-0.86
-0.86
-0.86
-0.85
-0.85
Expression Profile of Segment S37
Show/Hide
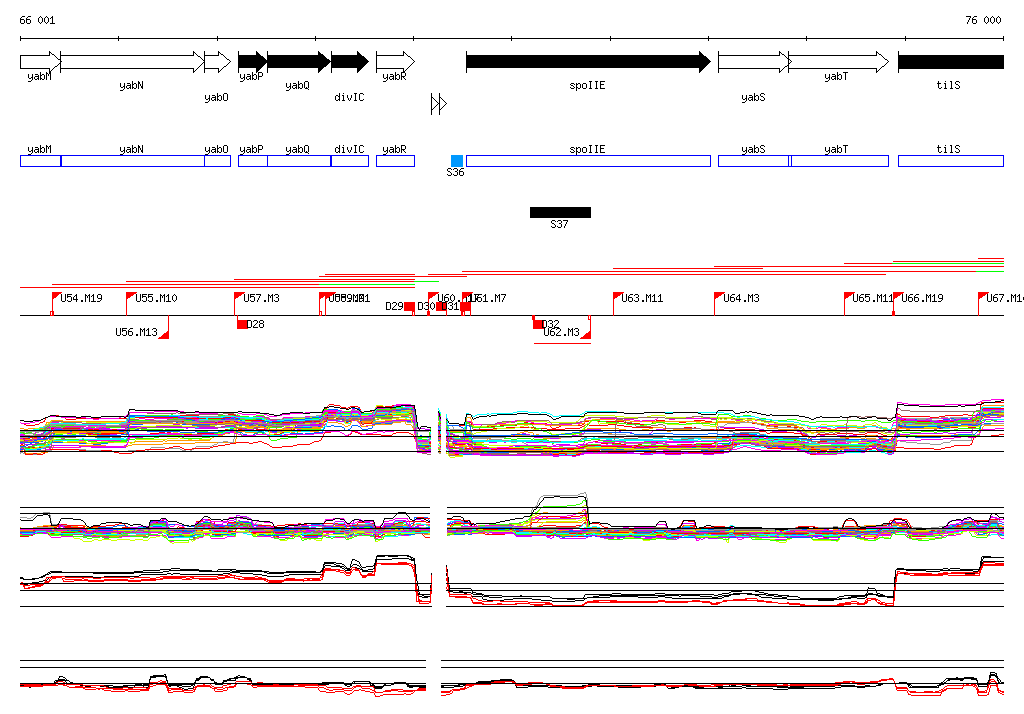
Genomic View of Gene/Segment S37
Show/Hide
(Legend)
Browse Genome Context