| Start Page |
|
 |
| Start Page |
|
|
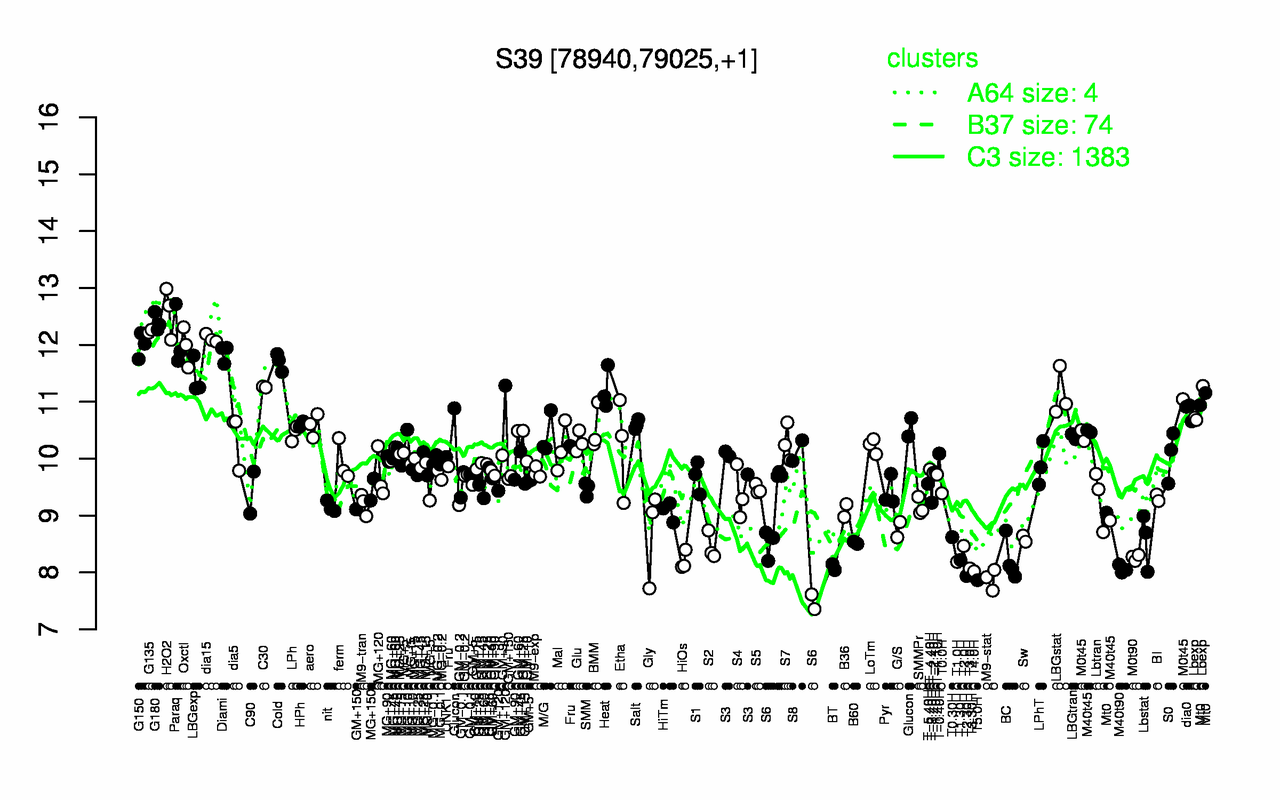
| H2O2 | G180 | G135 | dia15 | Paraq | G150 | Oxctl | Diami | Cold | LBGexp |
| 12.6 | 12.4 | 12.2 | 12.1 | 12.1 | 12 | 12 | 11.9 | 11.7 | 11.4 |
| T5.0H | M9-stat | T2.30H | T3.30H | T4.0H | M40t90 | T3.0H | BT | T1.0H | HiOs |
| 7.87 | 7.88 | 7.94 | 7.94 | 8.02 | 8.06 | 8.07 | 8.09 | 8.19 | 8.2 |