| Start Page |
|
 |
| Start Page |
|
|
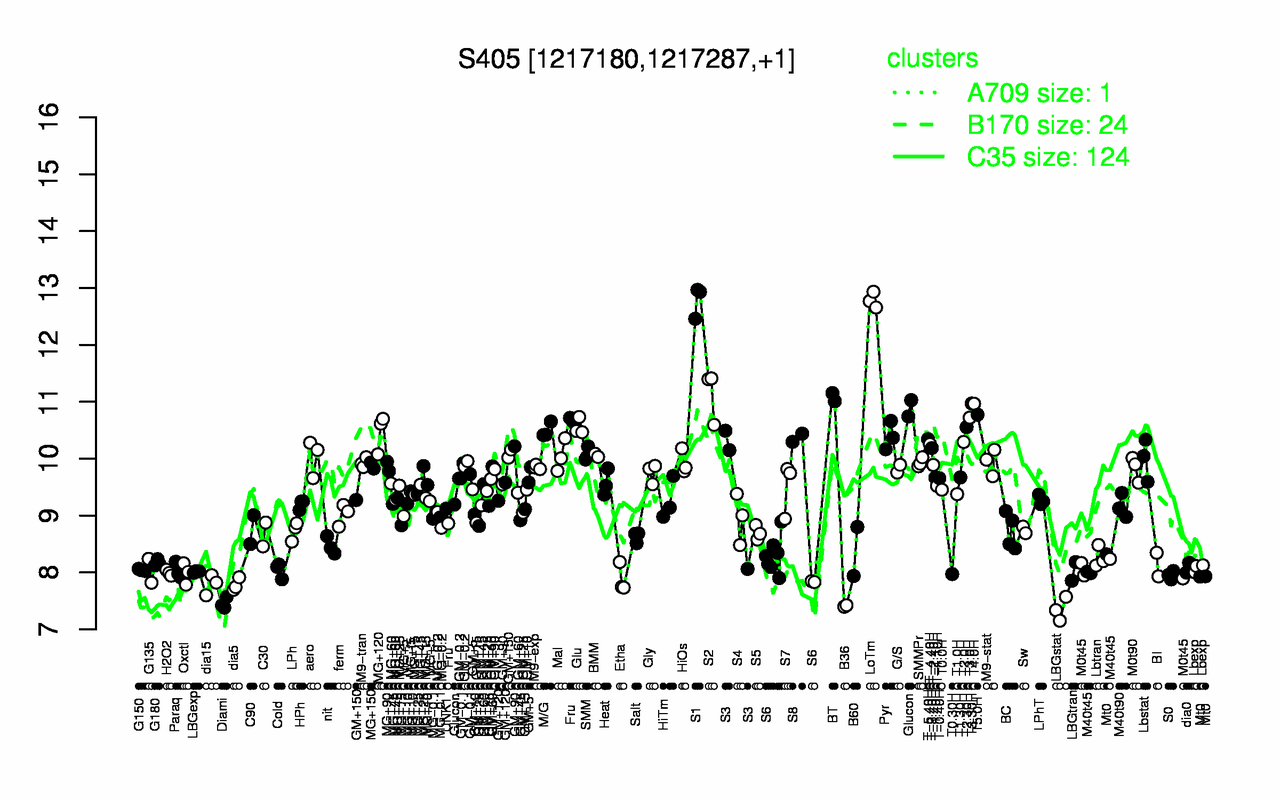
| LoTm | S1 | S2 | BT | T3.30H | T4.0H | T5.0H | T3.0H | Glu | T2.30H |
| 12.8 | 12.8 | 11.1 | 11.1 | 11 | 11 | 10.8 | 10.7 | 10.6 | 10.6 |
| LBGstat | B36 | Diami | dia5 | dia15 | Etha | S0 | T0.30H | Oxctl | H2O2 |
| 7.35 | 7.41 | 7.46 | 7.78 | 7.79 | 7.89 | 7.95 | 7.97 | 7.99 | 7.99 |