| Start Page |
|
 |
| Start Page |
|
|
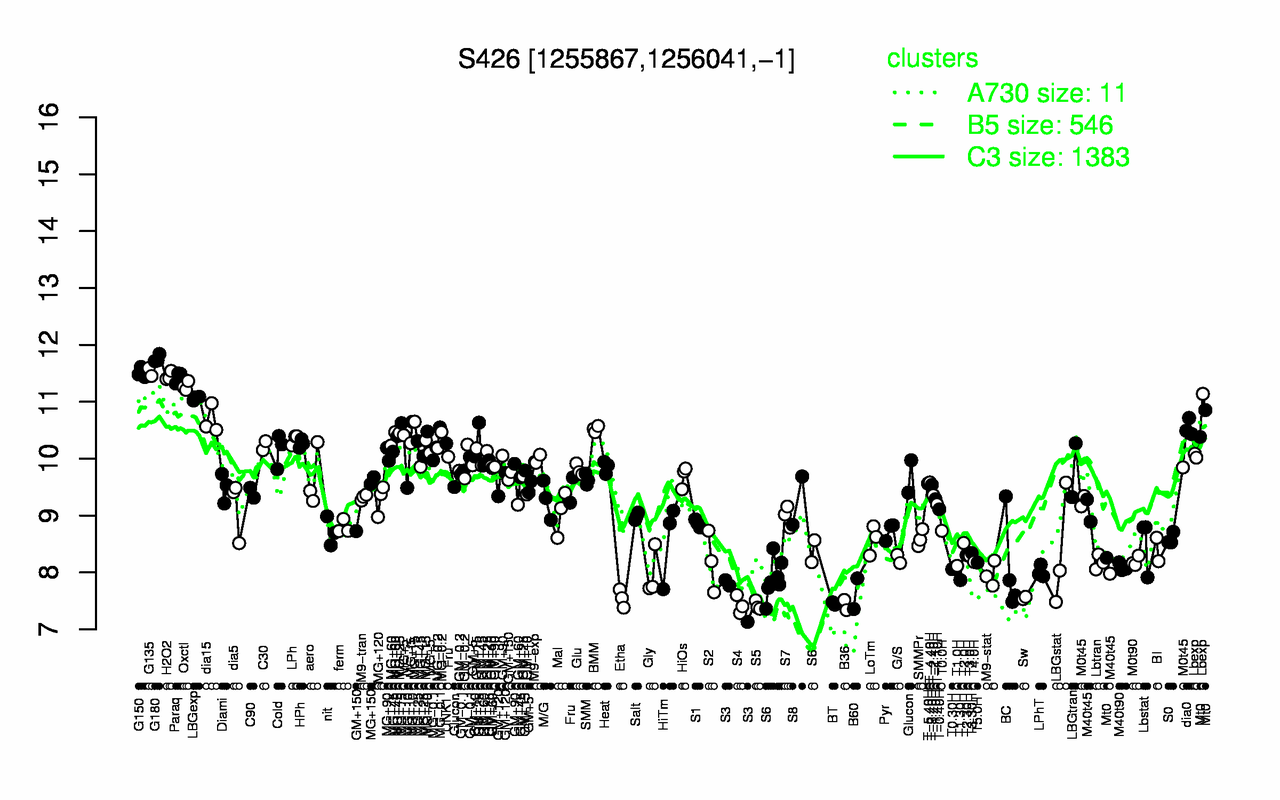
| G180 | G135 | G150 | H2O2 | Paraq | Oxctl | LBGexp | dia15 | dia0 | MG+15 |
| 11.8 | 11.5 | 11.5 | 11.5 | 11.4 | 11.3 | 11.1 | 10.7 | 10.5 | 10.5 |
| S5 | B36 | S4 | BT | Etha | Sw | S3 | B60 | T1.30H | M9-stat |
| 7.42 | 7.43 | 7.43 | 7.45 | 7.54 | 7.55 | 7.59 | 7.63 | 7.87 | 7.97 |