B. subtilis Expression Data Browser
Start Page
B. subtilis Expression Data Browser
Gene/Segment:
S430
Locus Tag:
new_1262896_1264544
Details about S430
Show/Hide
Highest Expression Conditions
Cold
C30
G135
G180
G150
Oxctl
Fru
HPh
Glu
UNK1
11.7
11.2
10.9
10.7
10.4
10.1
10
9.94
9.8
9.8
Lowest Expression Conditions
B36
BT
S6
S5
B60
S4
Sw
T3.0H
M9-stat
Etha
7.39
7.44
7.62
7.81
7.83
7.98
8
8.01
8.01
8.03
Most Positively Correlated Segments
S169
S36
S14
S1581
rnpA
S1580
S244
S240
S65
ypsC
0.83
0.83
0.77
0.77
0.76
0.75
0.75
0.75
0.74
0.74
Most Negatively Correlated Segments
yknU
yknV
phrG
S704
sigF
yccK
spoIIAA
ggt
spoIIAB
yycN
-0.69
-0.69
-0.67
-0.65
-0.65
-0.65
-0.64
-0.64
-0.64
-0.64
Expression Profile of Segment S430
Show/Hide
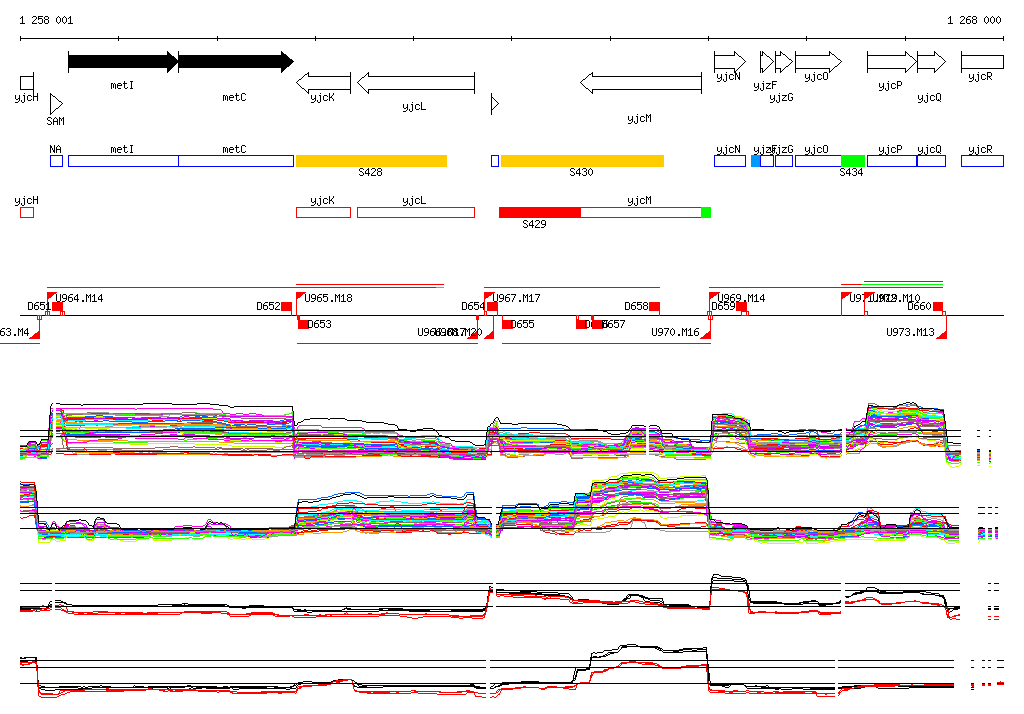
Genomic View of Gene/Segment S430
Show/Hide
(Legend)
Browse Genome Context