| Start Page |
|
 |
| Start Page |
|
|
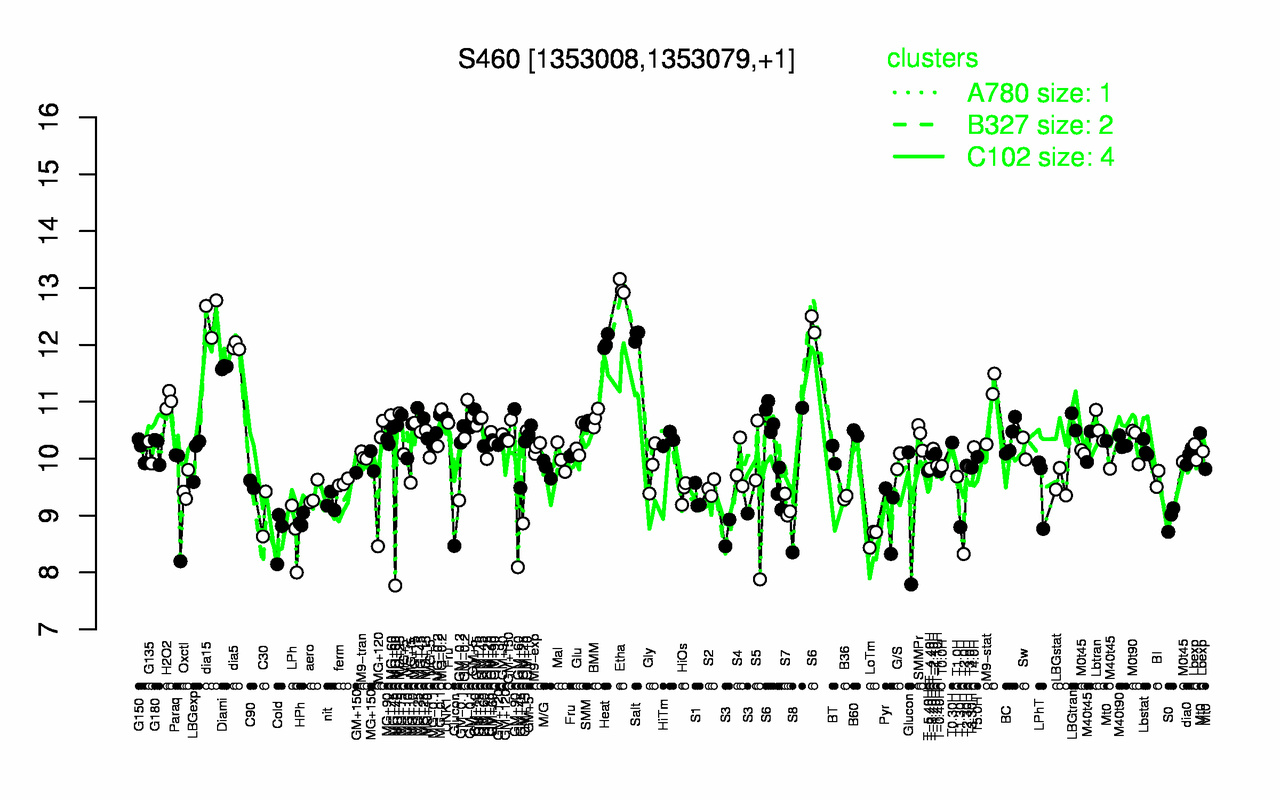
| Etha | dia15 | Salt | Heat | dia5 | Diami | H2O2 | M9-stat | MG+25 | BMM |
| 13 | 12.5 | 12.2 | 12 | 12 | 11.6 | 11 | 11 | 10.8 | 10.7 |
| T2.0H | LoTm | LPh | Cold | Glucon | T1.30H | S3 | HPh | S0 | C30 |
| 8.32 | 8.62 | 8.65 | 8.66 | 8.79 | 8.8 | 8.81 | 8.91 | 8.95 | 9.03 |