| Start Page |
|
 |
| Start Page |
|
|
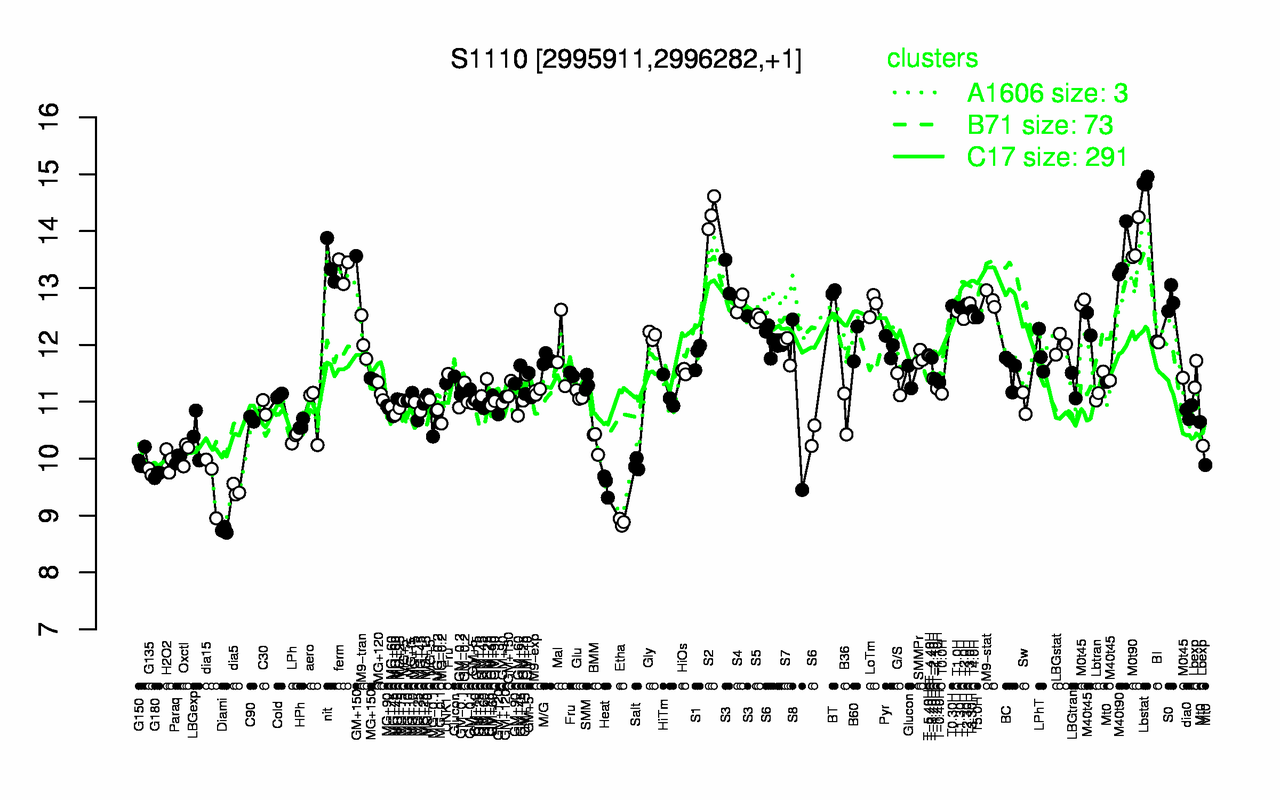
| Lbstat | S2 | M0t90 | M40t90 | nit | ferm | S3 | BT | M9-stat | S0 |
| 14.9 | 14.3 | 13.8 | 13.6 | 13.4 | 13.3 | 13 | 12.9 | 12.8 | 12.8 |
| Diami | Etha | dia5 | Heat | dia15 | G180 | G135 | Salt | H2O2 | Paraq |
| 8.75 | 8.88 | 9.44 | 9.54 | 9.59 | 9.72 | 9.77 | 9.89 | 9.97 | 10 |