| Start Page |
|
 |
| Start Page |
|
|
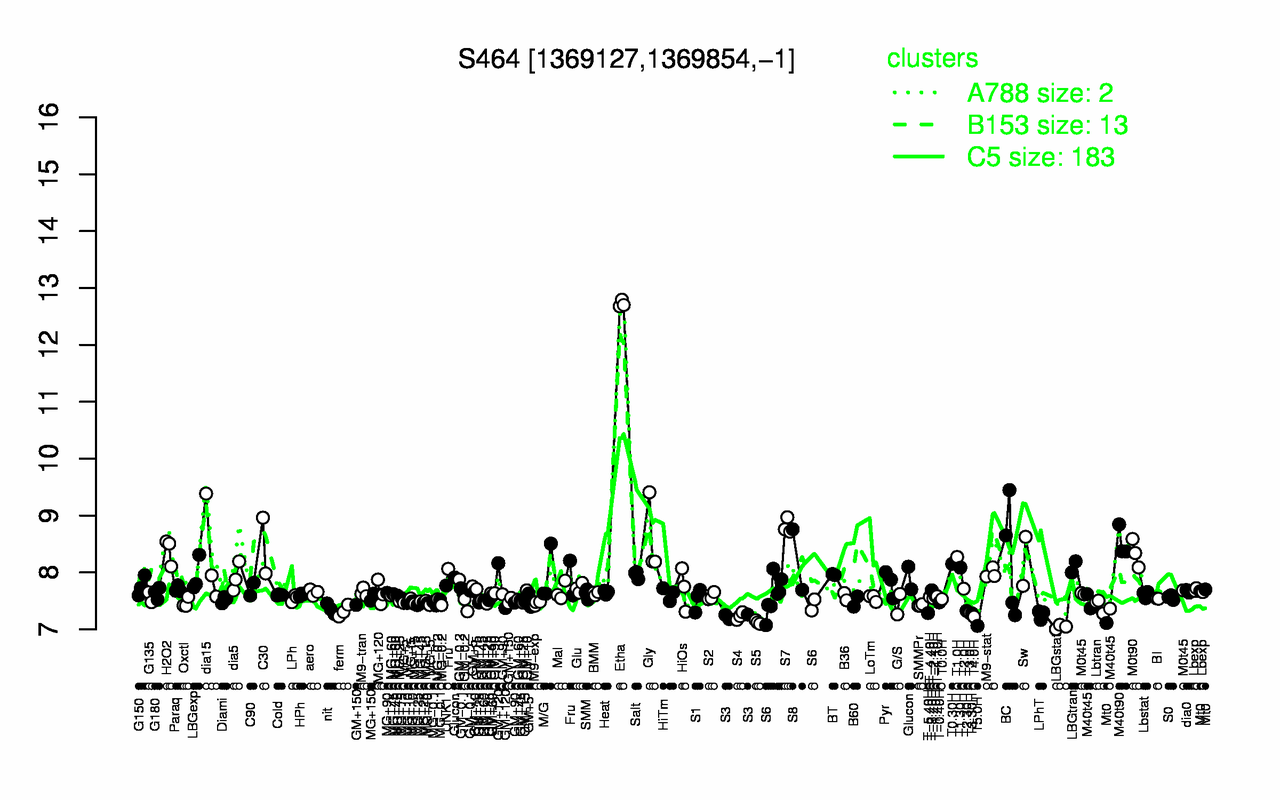
| Etha | S7 | Gly | M40t90 | C30 | H2O2 | M0t90 | dia15 | T1.0H | S8 |
| 12.7 | 8.81 | 8.6 | 8.53 | 8.47 | 8.39 | 8.34 | 8.3 | 8.27 | 8.23 |
| LBGstat | T5.0H | S5 | T4.0H | S3 | S4 | LPhT | T3.30H | T-5.40H | T3.0H |
| 7.04 | 7.06 | 7.13 | 7.22 | 7.23 | 7.23 | 7.26 | 7.28 | 7.29 | 7.29 |