| Start Page |
|
 |
| Start Page |
|
|
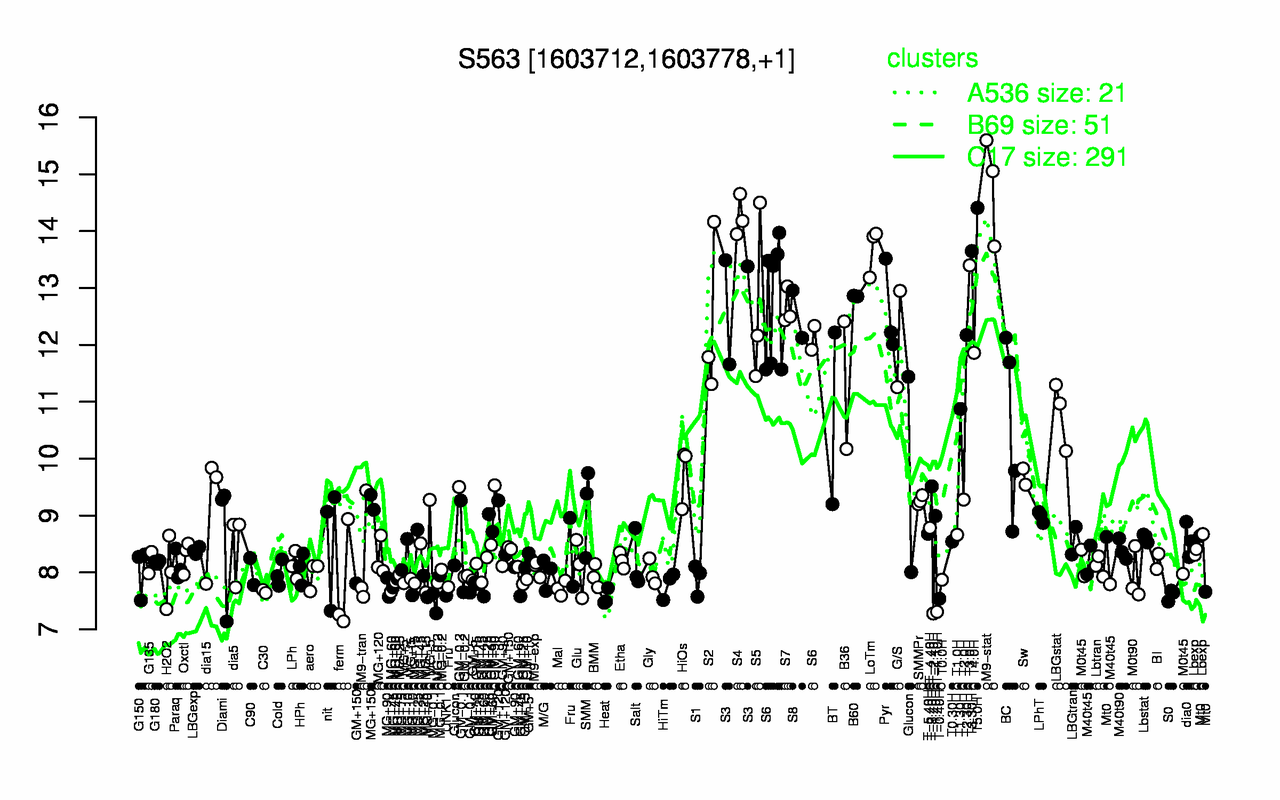
| M9-stat | T5.0H | S4 | LoTm | T3.30H | T3.0H | B60 | S3 | S5 | S7 |
| 14.8 | 14.4 | 14.3 | 13.7 | 13.6 | 13.4 | 12.9 | 12.8 | 12.7 | 12.7 |
| T-2.40H | T-1.10H | T-0.40H | Heat | UNK1 | S0 | MG-0.1 | C30 | Mal | MG+90 |
| 7.28 | 7.31 | 7.54 | 7.56 | 7.59 | 7.61 | 7.62 | 7.67 | 7.72 | 7.74 |