| Start Page |
|
 |
| Start Page |
|
|
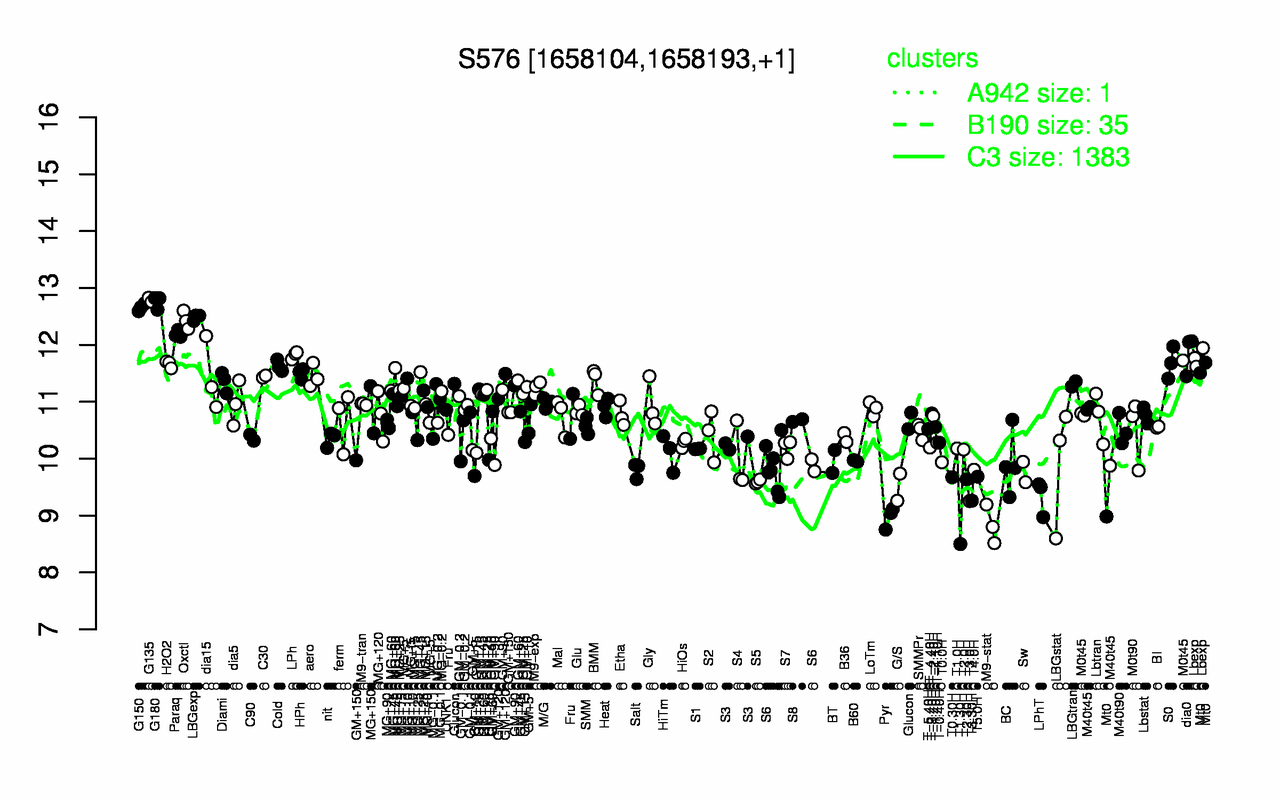
| G135 | G180 | G150 | LBGexp | Oxctl | Paraq | dia0 | LPh | Lbexp | S0 |
| 12.8 | 12.8 | 12.7 | 12.5 | 12.4 | 12.2 | 11.9 | 11.8 | 11.8 | 11.7 |
| T1.30H | M9-stat | Pyr | T3.0H | T3.30H | LPhT | G/S | S5 | T2.30H | T0.30H |
| 8.5 | 8.84 | 8.97 | 9.25 | 9.26 | 9.34 | 9.5 | 9.59 | 9.64 | 9.67 |