| Start Page |
|
 |
| Start Page |
|
|
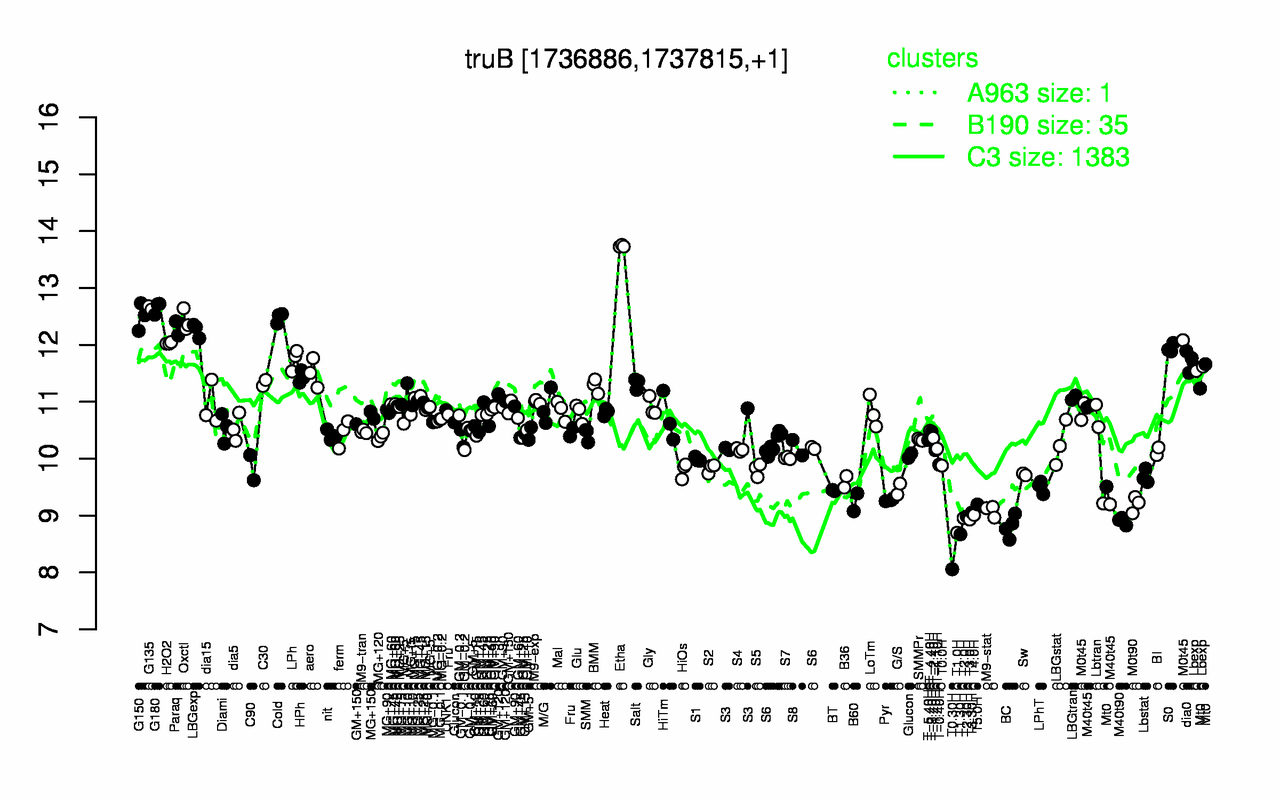
| Etha | G180 | G135 | G150 | Cold | Oxctl | Paraq | LBGexp | H2O2 | S0 |
| 13.7 | 12.7 | 12.7 | 12.5 | 12.5 | 12.4 | 12.3 | 12.3 | 12 | 11.9 |
| T0.30H | T1.30H | T1.0H | BC | M40t90 | T3.0H | T2.0H | T2.30H | T4.0H | T3.30H |
| 8.06 | 8.67 | 8.7 | 8.81 | 8.9 | 8.93 | 8.96 | 8.98 | 9.01 | 9.05 |