| Start Page |
|
 |
| Start Page |
|
|
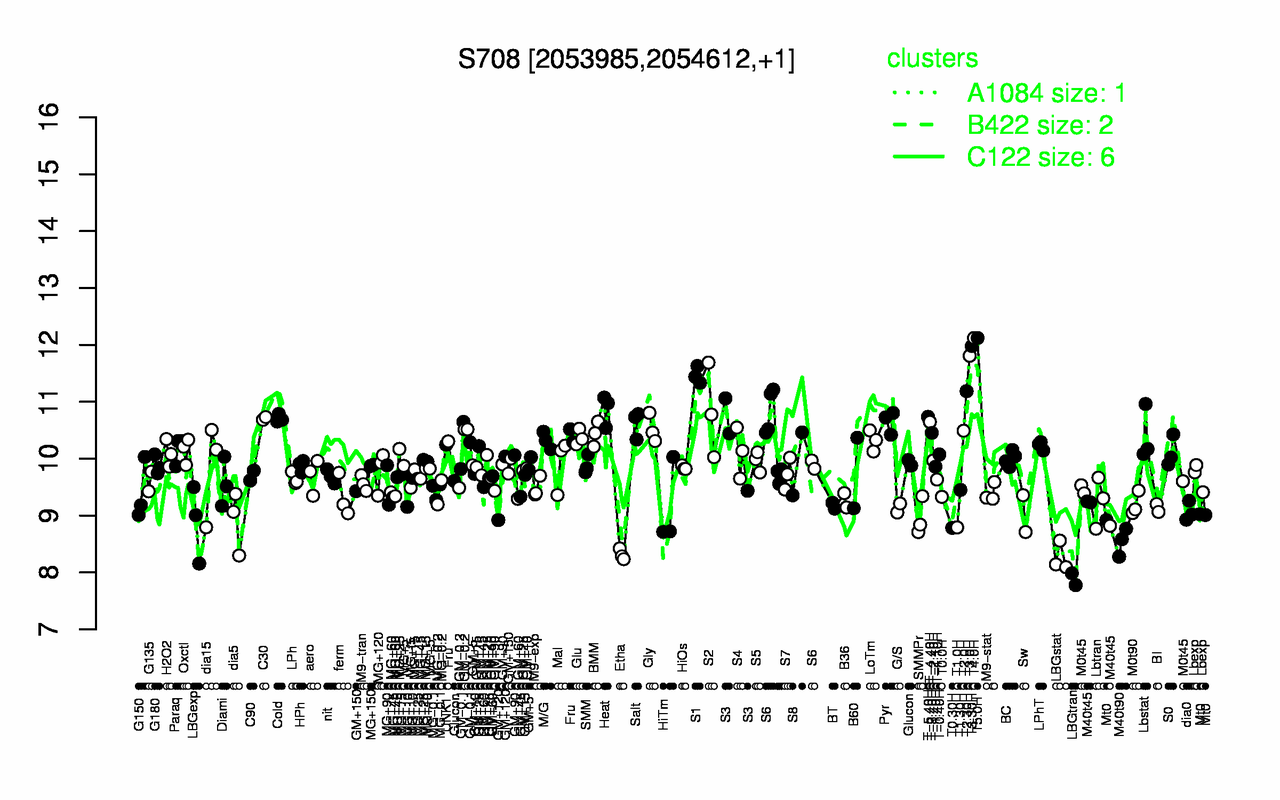
| T5.0H | T4.0H | T3.30H | T3.0H | S1 | T2.30H | Heat | S2 | T-5.40H | C30 |
| 12.1 | 12.1 | 12 | 11.8 | 11.5 | 11.2 | 10.9 | 10.8 | 10.7 | 10.7 |
| LBGtran | LBGstat | Etha | M40t90 | T0.30H | T1.0H | LBGexp | dia5 | SMMPr | Mt0 |
| 7.88 | 8.26 | 8.31 | 8.54 | 8.78 | 8.79 | 8.89 | 8.91 | 8.96 | 8.98 |