| Start Page |
|
 |
| Start Page |
|
|
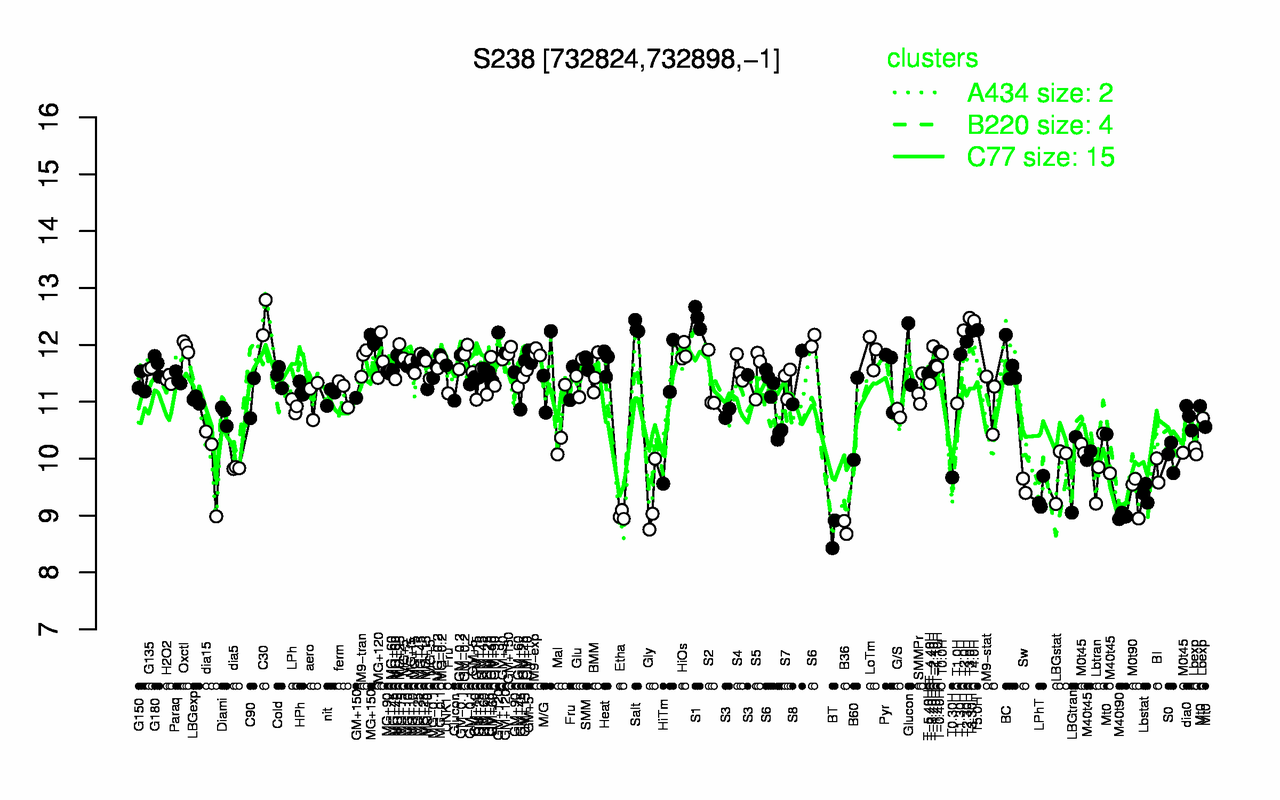
| C30 | S1 | T3.0H | T4.0H | Salt | T5.0H | T2.0H | T3.30H | MG+150 | T2.30H |
| 12.5 | 12.5 | 12.5 | 12.4 | 12.3 | 12.3 | 12.3 | 12.2 | 12.1 | 12.1 |
| BT | B36 | M40t90 | Etha | Gly | LPhT | M0t90 | Lbstat | Sw | T0.30H |
| 8.67 | 8.79 | 8.99 | 9 | 9.26 | 9.36 | 9.38 | 9.39 | 9.52 | 9.67 |