| Start Page |
|
 |
| Start Page |
|
|
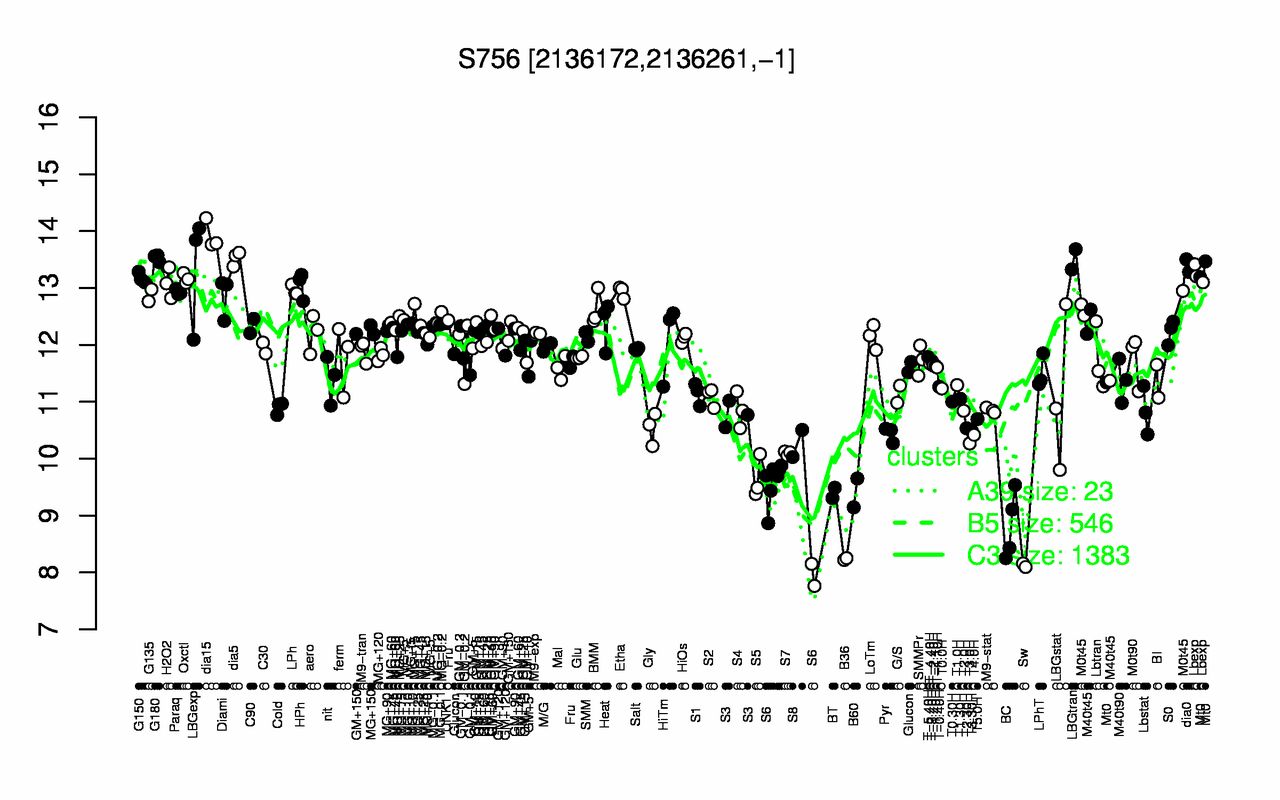
| dia15 | G180 | dia5 | LBGtran | dia0 | LBGexp | Lbexp | G150 | Oxctl | H2O2 |
| 13.9 | 13.5 | 13.5 | 13.5 | 13.4 | 13.3 | 13.2 | 13.2 | 13.2 | 13.1 |
| Sw | B36 | BC | S6 | B60 | BT | S5 | S7 | T3.0H | S8 |
| 8.13 | 8.24 | 8.83 | 9.23 | 9.4 | 9.4 | 9.65 | 10.1 | 10.3 | 10.3 |