B. subtilis Expression Data Browser
Start Page
B. subtilis Expression Data Browser
Gene/Segment:
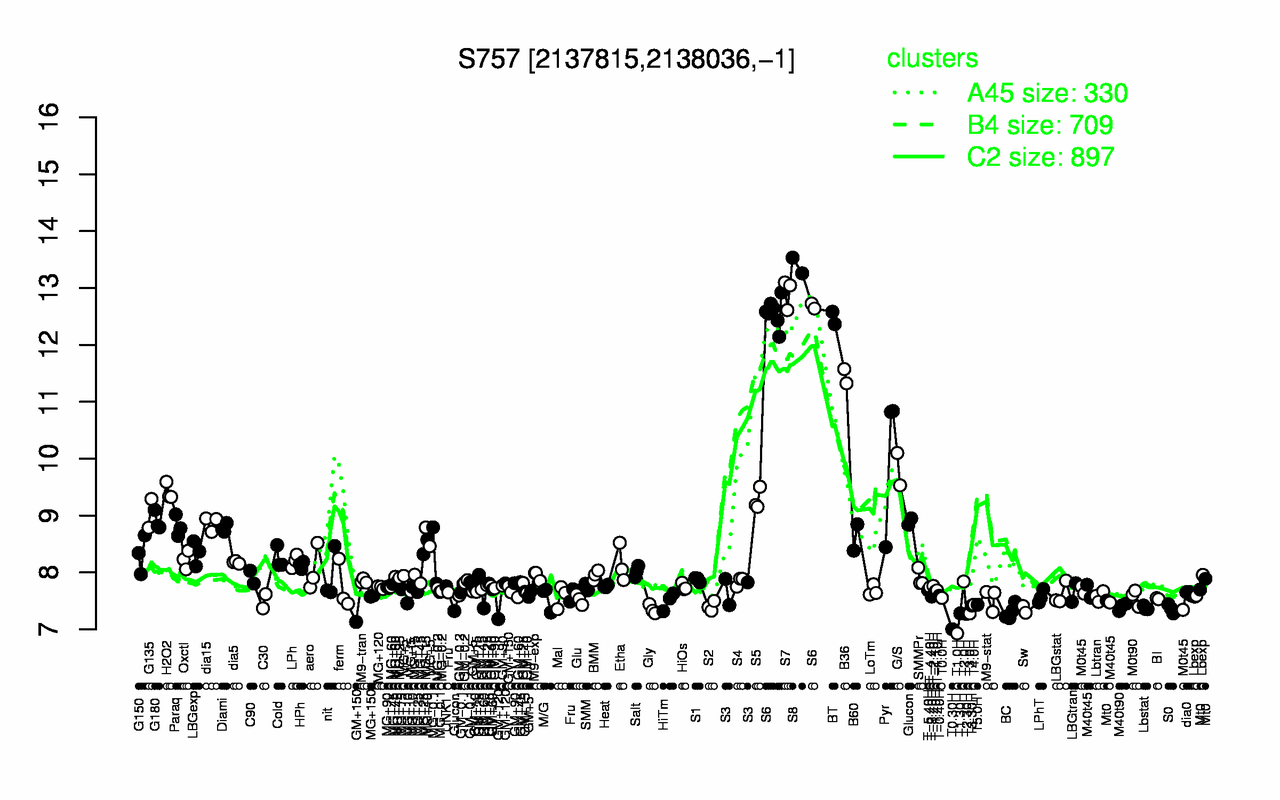
S757
Locus Tag:
new_2137815_2138036_c
Details about S757
Show/Hide
Highest Expression Conditions
S8
S7
S6
BT
B36
Pyr
G/S
H2O2
S5
G135
13.4
12.9
12.6
12.5
11.4
10
9.82
9.42
9.28
9.04
Lowest Expression Conditions
T1.0H
T0.30H
T2.30H
T3.0H
T1.30H
BC
Sw
Gly
S0
Lbstat
6.93
7
7.27
7.28
7.28
7.31
7.35
7.35
7.36
7.38
Most Positively Correlated Segments
yodN
spsI
yabG
yfnD
cotS
ylbD
cotSA
ytxO
yvdP
ylbE
0.98
0.95
0.95
0.94
0.94
0.94
0.94
0.94
0.94
0.94
Most Negatively Correlated Segments
ptkA
parA
degS
ykuH
parB
ywqC
ypjP
S607
bceR
S511
-0.8
-0.8
-0.77
-0.77
-0.77
-0.77
-0.77
-0.76
-0.76
-0.76
Expression Profile of Segment S757
Show/Hide
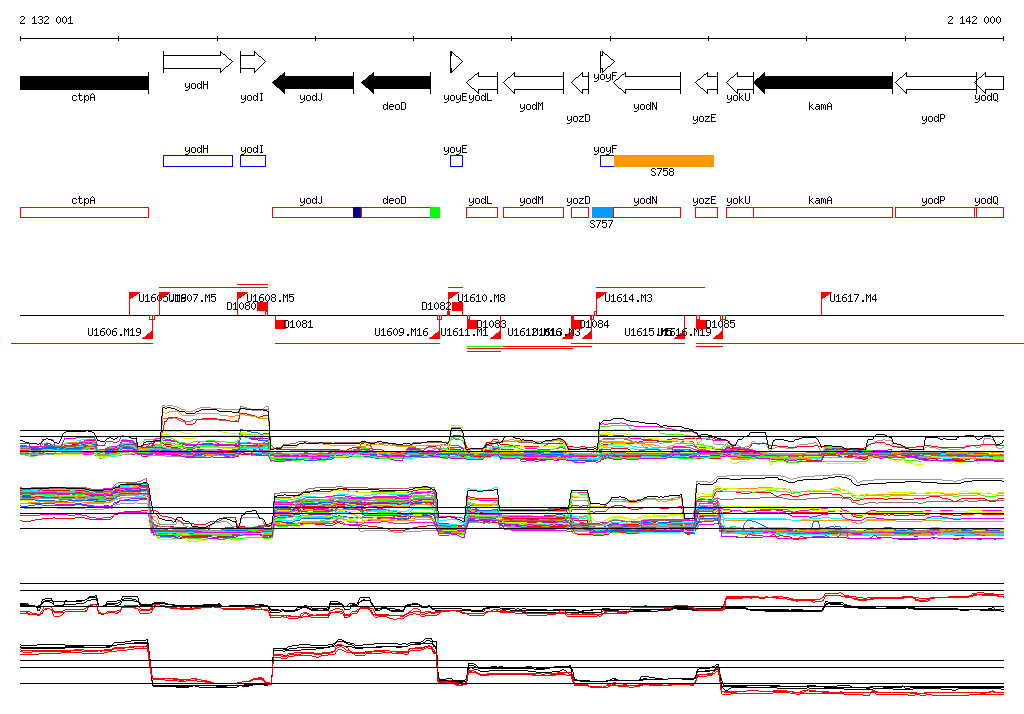
Genomic View of Gene/Segment S757
Show/Hide
(Legend)
Browse Genome Context