| Start Page |
|
 |
| Start Page |
|
|
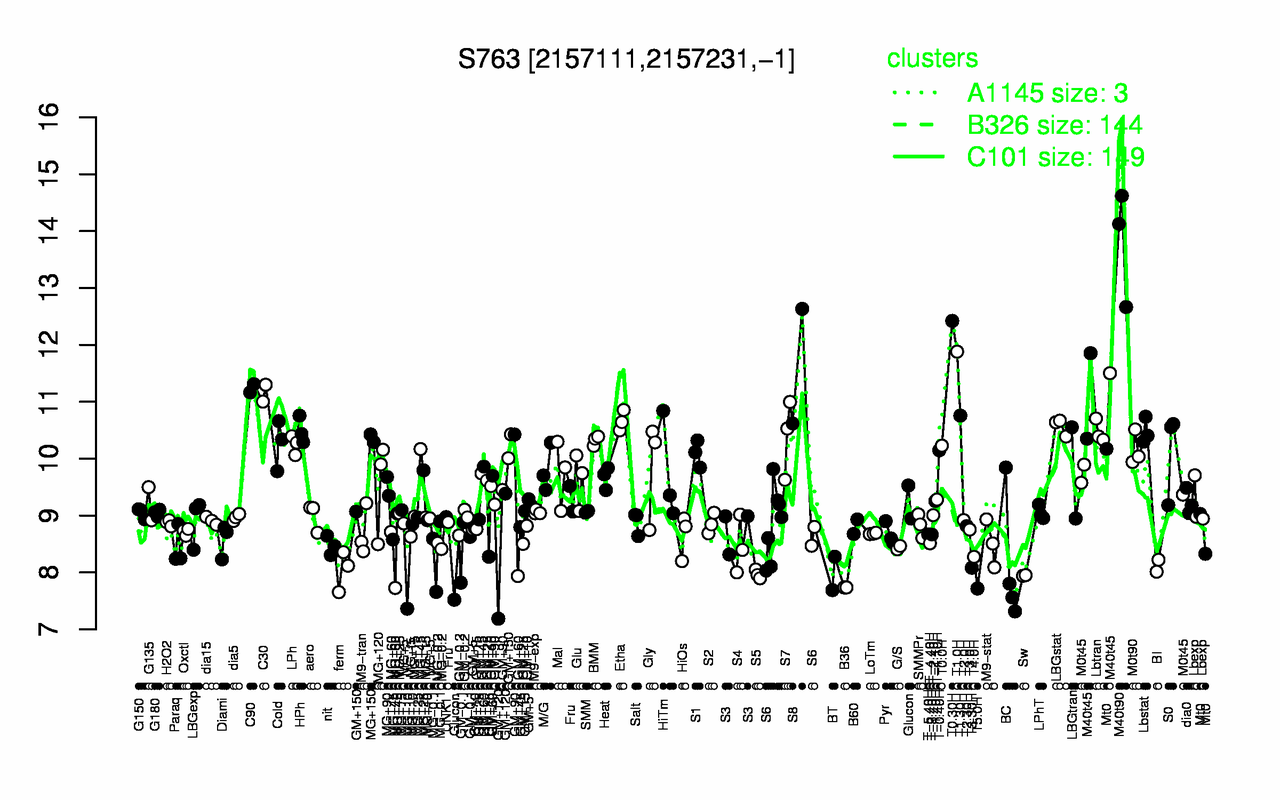
| M40t90 | T0.30H | T1.0H | S8 | C90 | M40t45 | C30 | T1.30H | Etha | LBGstat |
| 13.8 | 12.4 | 11.9 | 11.6 | 11.2 | 11.2 | 11.2 | 10.8 | 10.7 | 10.6 |
| T5.0H | B36 | Sw | S5 | BT | ferm | T3.30H | BI | BC | MG+60 |
| 7.72 | 7.74 | 7.95 | 7.97 | 7.98 | 8.04 | 8.08 | 8.12 | 8.13 | 8.22 |