| Start Page |
|
 |
| Start Page |
|
|
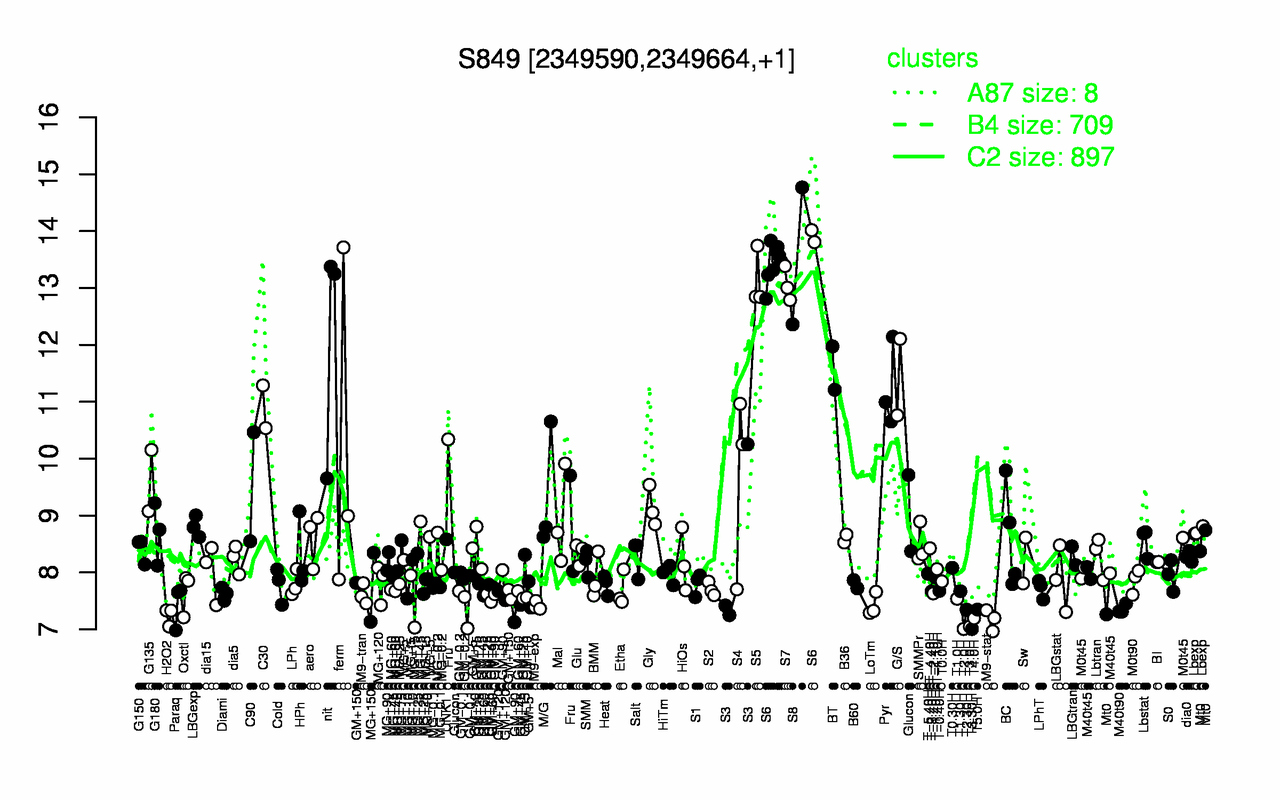
| S8 | S6 | S5 | S7 | nit | BT | G/S | Pyr | C30 | ferm |
| 13.6 | 13.5 | 13.1 | 13.1 | 12.1 | 11.6 | 11.4 | 11.3 | 10.9 | 10.2 |
| T3.30H | T2.0H | T3.0H | M9-stat | T4.0H | H2O2 | T2.30H | T5.0H | M40t90 | M9-exp |
| 7.01 | 7.01 | 7.05 | 7.17 | 7.19 | 7.24 | 7.34 | 7.35 | 7.36 | 7.42 |