| Start Page |
|
 |
| Start Page |
|
|
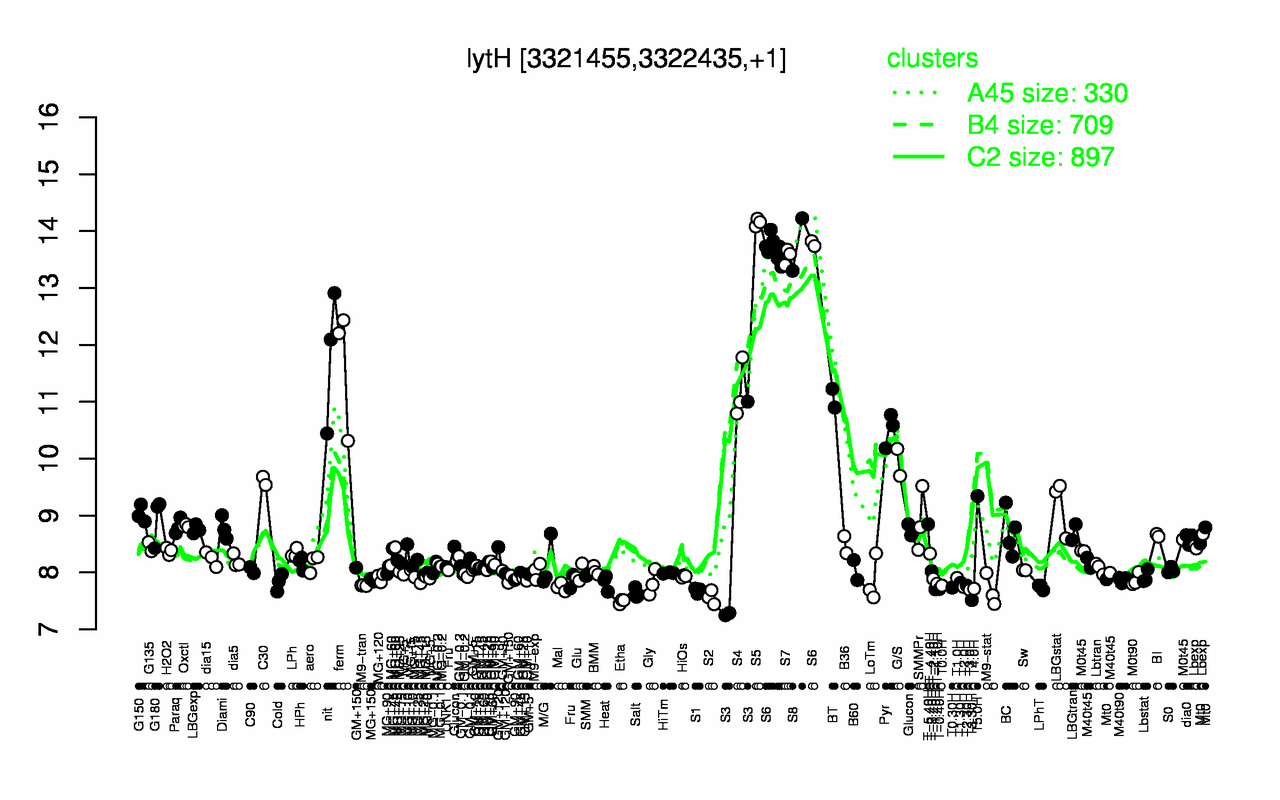
| S5 | S8 | S6 | S7 | nit | ferm | S4 | BT | Pyr | G/S |
| 14.2 | 13.8 | 13.7 | 13.6 | 11.8 | 11.6 | 11.2 | 11.1 | 10.5 | 9.93 |
| Etha | T3.30H | S2 | Salt | M9-stat | S1 | T3.0H | T-1.40H | T-0.40H | T4.0H |
| 7.49 | 7.51 | 7.56 | 7.64 | 7.68 | 7.68 | 7.69 | 7.7 | 7.71 | 7.71 |