| Start Page |
|
 |
| Start Page |
|
|
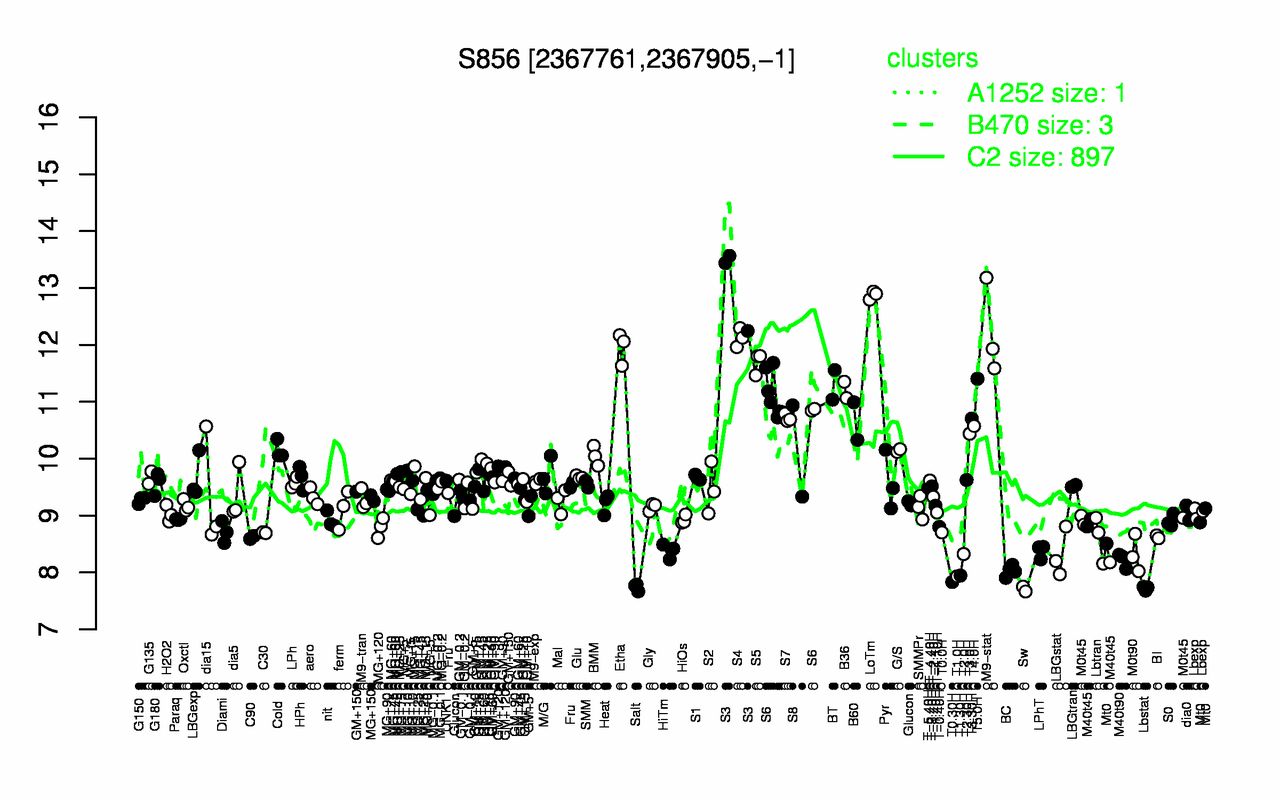
| S3 | LoTm | M9-stat | S4 | Etha | S5 | T5.0H | BT | B36 | S6 |
| 13.1 | 12.9 | 12.2 | 12.1 | 12 | 11.7 | 11.4 | 11.3 | 11.2 | 11.1 |
| Sw | Lbstat | Salt | T0.30H | T1.0H | T1.30H | BC | M40t90 | T2.0H | M0t90 |
| 7.71 | 7.72 | 7.74 | 7.83 | 7.93 | 7.95 | 8.03 | 8.22 | 8.32 | 8.32 |